Calcium, food by food
Ranking · Calcium
Builds your bones and teeth.
An adult is advised to get about 1,000 mg a day. ?
How we counted this
Health Canada’s Dietary Reference Intakes, adults 19–30. The word beside each food says how much of that one serving gives.
The plain words beside each food: “a lot” means one serving gives at least 20% of the daily amount, “some” at least 10%, “a little” at least 2%; below that it says “almost none”. Each row prints its percentage of the daily amount, rounded to a whole number, and the word is read from that printed percentage (a row at 9.6% prints 10% and reads “some”). The cut-offs are ours, one set for every page: 20% and 10% are borrowed from the US labelling terms “high” and “good source”, and applied to Health Canada’s daily amount; Health Canada’s own shopper rule says 15%, and we keep one number so a percentage never changes meaning (provisional: they may change in a later method version).
On calcium, a food on the absorption card above is read by the calcium that gets in, counted as milk’s: see the note under the card. The list below stays in the order of the calcium the databases list, so a card food can sit under one whose word is lower: its word counts what gets in, the order counts what is listed. Each such row prints both percentages.
What it does: NIH Office of Dietary Supplements, calcium fact sheet for health professionals. How much a day: Health Canada, Dietary reference intakes tables: Reference values for elements.
Calcium your body actually gets
Measured in people, the most calcium per serving comes from cooked kale, tempeh and soybeans. Sardines, canned in water, Skim milk and Milk, 2% list more, but aren’t on the absorption card, so what your body gets from them isn’t shown.
Dairy-free foods, ranked; whole milk shown for comparison. One serving each. Big number: the calcium from that serving that gets in (the label’s amount times the share a study found is absorbed). Small number: what the label says, crossed out. ?
⚑ the study tested more than twice a serving’s calcium, so absorption from one serving may differ · ◇ the study doesn’t say how the food was prepared
- 1
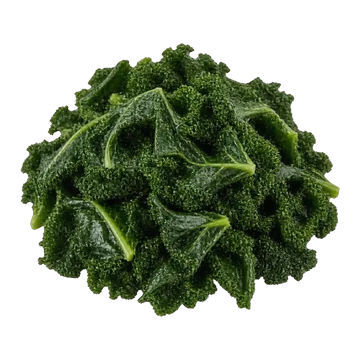 Kale, cooked85 g · 40.9% gets in · tested at 288 mg ⚑52mglabel 128
- 2
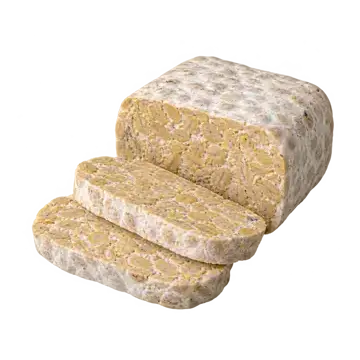 Tempeh85 g · 36.9% gets in · tested at 130 mg ◇35mglabel 94
- 3
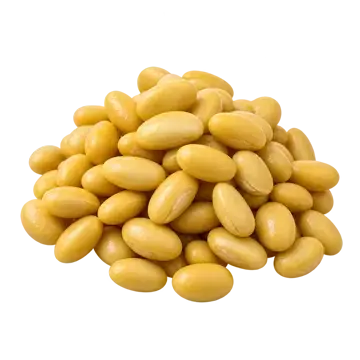 Soybeans, cooked91 g · 31% gets in · tested at 98 mg ◇29mglabel 93
- 4
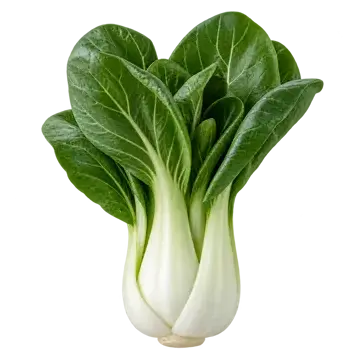 Bok choy, raw85 g · 51.9% gets in · tested at 83 mg ◇27mglabel 53
- 5
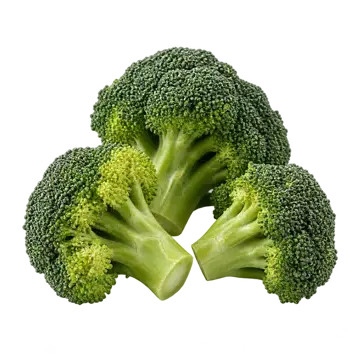 Broccoli, raw85 g · 47.8% gets in · tested at 83 mg ⚑ ◇19mglabel 39
- 6
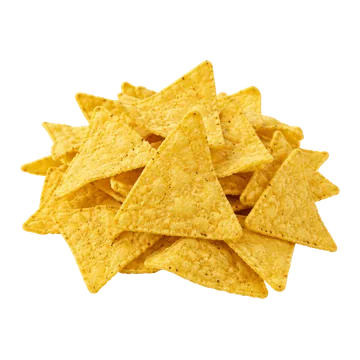
 Corn tortillas55 g · 32% gets in · tested at 94 mg ⚑14mglabel 45
- 7
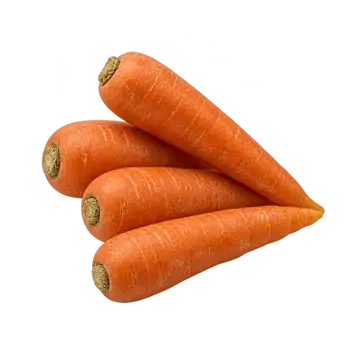 Carrots, raw85 g · 52.1% gets in · tested at 38 mg ◇13mglabel 26
- 8
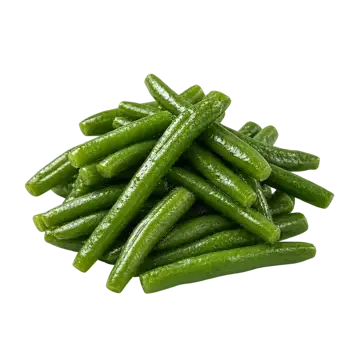 Green beans, cooked85 g · 28% gets in · test dose not reported10mglabel 37
- 9
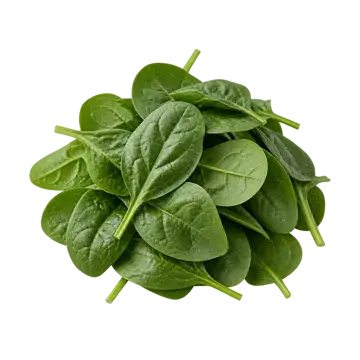 Spinach, raw85 g · 5.1% gets in · tested at 200 mg ⚑ ◇3mglabel 57
Last, though its label shows more calcium than 5 of the foods that beat it.
- ref
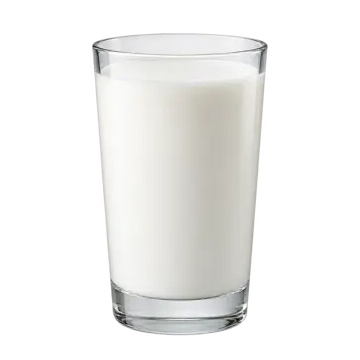 Whole milk263 g · reference, not ranked · 32.1% gets in · tested at 312 mg104mglabel 324
Ranked among the 9 reviewed foods on this card. The order comes from absorption studies of each food; where a food has more than one study, the card uses the one closest to a serving's dose.
How the big number is worked: the calcium listed for one serving, times the share a study found gets in. Cooked kale: 128 mg × 40.9% = 52.1 mg. The dose after “tested at” is what the volunteers were given, shown so you can see how far it was from a serving (⚑ marks more than twice as much); it is not part of the sum.
Where a nutrient list or a food page says “a lot”, “some” or “a little” for the calcium of a food on this card, the word is read from the calcium that gets in, counted as milk’s: the listed calcium scaled by how well the food’s calcium gets in compared with milk’s (32.1% here: 104 mg of the 324 mg listed in a serving of milk gets in), read against 1,000 mg a day. Cooked kale: 128 mg listed × 40.9% (gets in from this food) ÷ 32.1% (from milk) counts as 162 mg of milk’s calcium, 16% of 1,000 mg, so “some”.
What the databases list
Every reviewed food by the calcium the databases list, with or without an absorption study, most first. These numbers are not absorption-adjusted.
The word and percentage beside a food are not all on that listed basis: for the 9 foods on the absorption card above they are read from the calcium that gets in (marked “allowing for absorption”), so a food can list more calcium than another and still read lower, as raw spinach does beside bok choy.
How we counted this
Listed for 194 of the 198 preparations on this page (150 foods). The other 4 aren’t zero, just not listed: see “Not listed” below.
191 of them are ranked below, by what one serving gives; the other 3 list it but have no serving size on file, so they follow, per 100 g.
The 159 reviewed foods (229 preparations) are counted here, and raw and cooked spinach are two preparations of one food. Each row below is one preparation, and 198 of them are on this page. The other 31 are left out: 19 raw or dry forms of a food ranked as eaten (listed below) and 12 fortified foods. Imported foods are listed separately below, not ranked. Every amount here is copied from the national food databases, as published. A serving’s weight is shown rounded, and the amount is worked from its exact weight, so a row can differ slightly from weight times the per-100 g figure.
- 1
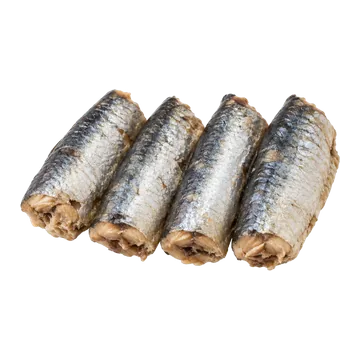 A lot373mg679 mg / 100 g
- 2A lot321mg122 mg / 100 g
- 3A lot316mg120 mg / 100 g
- 4
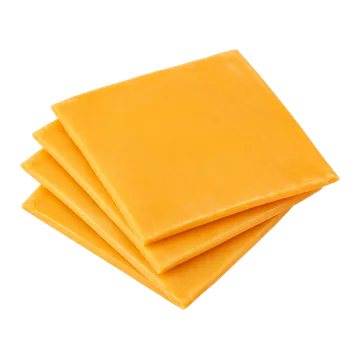 A lot314mg1,045 mg / 100 g
- 5
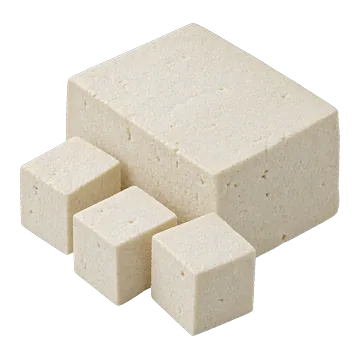 A lot298mg350 mg / 100 g
- 6
 A lot293mg975 mg / 100 g
- 7
 A lot267mg890 mg / 100 g
- 8
 A lot251mg130 mg / 100 g
- 9A lot219mg113.5 mg / 100 g
- 10A lot216mg254 mg / 100 g
- 11
 A lot212mg707 mg / 100 g
- 12
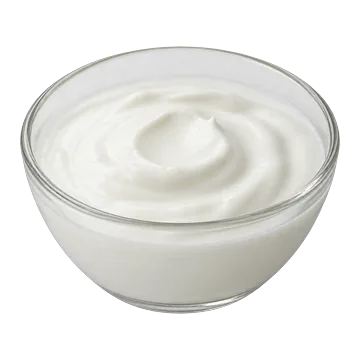 A lot210mg183 mg / 100 g
- 13
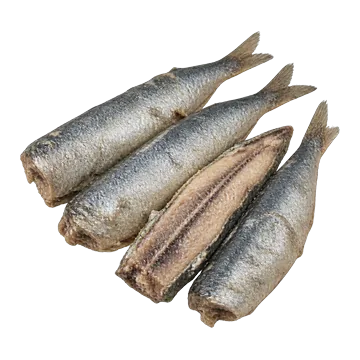 A lot210mg382 mg / 100 g
- 14
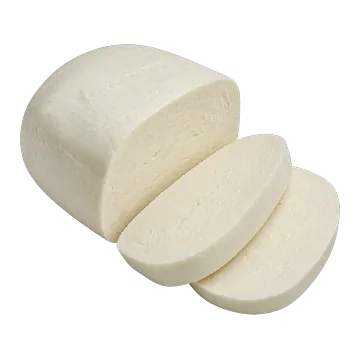 A lot208mg693 mg / 100 g
- 15
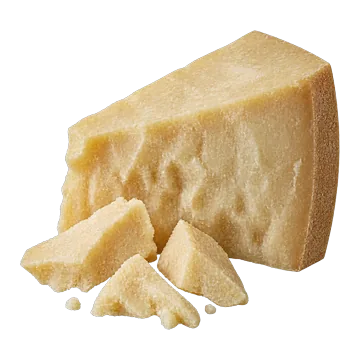 Some178mg1,184 mg / 100 g
- 16
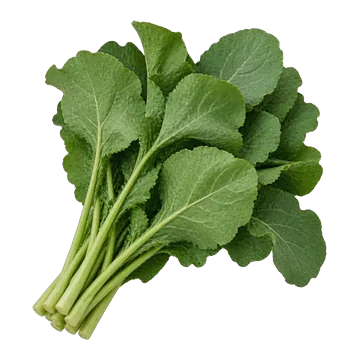 Some162mg190 mg / 100 g
- 17
 Some146mg126.8 mg / 100 g
- 18
 Some141mg469 mg / 100 g
- 19
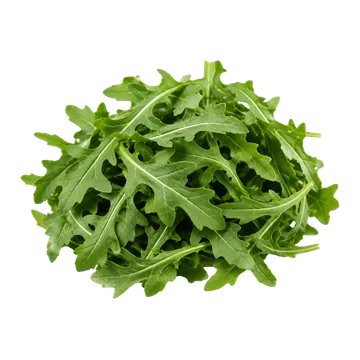 Some136mg160 mg / 100 g
- 20
 Some134mg128 mg / 100 g
- 21
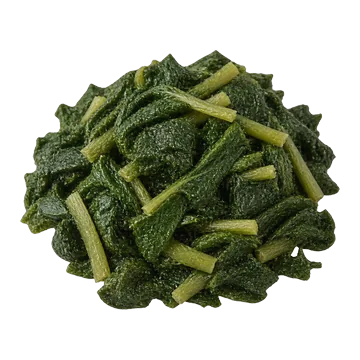 Some129mg152 mg / 100 g
- 22
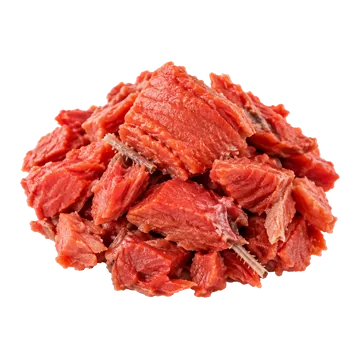 Some128mg232 mg / 100 g
- 23Kale, cooked85 g · US food database (USDA Foundation Foods)16% of 1,000 mg, once its calcium is counted as milk’s (162 mg); 13% on the listed amount aloneSome, allowing for absorption128mg150 mg / 100 g
- 24
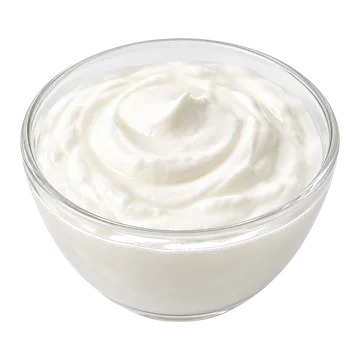 Some127mg110 mg / 100 g
- 25
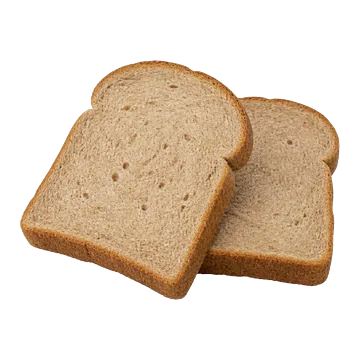 Some122mg163 mg / 100 g
- 26Some116mg137 mg / 100 g
- 27Some116mg136 mg / 100 g
- 28
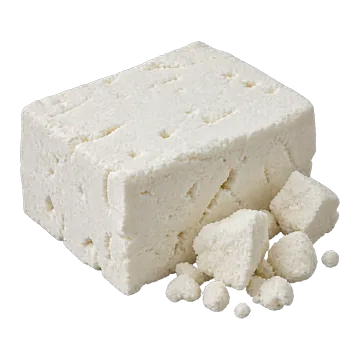 Some111mg371.1 mg / 100 g
- 29
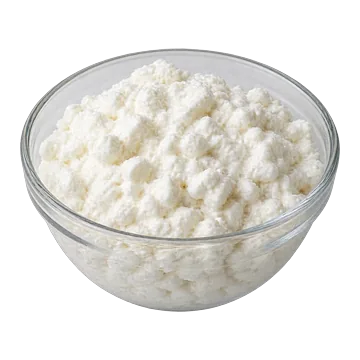 Some110mg88.27 mg / 100 g
- 30
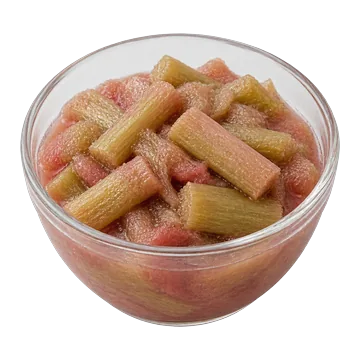 Some106mg76 mg / 100 g
- 31
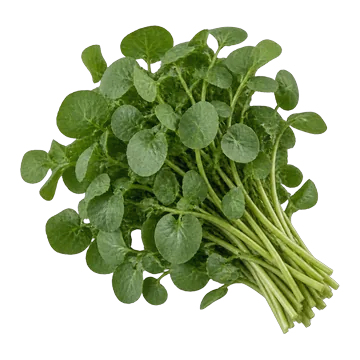 Some102mg120 mg / 100 g
- 32
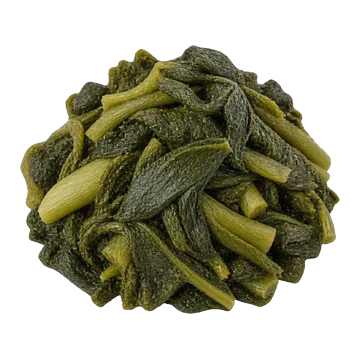 Some100mg118 mg / 100 g
- 33
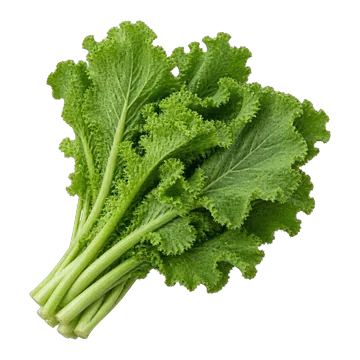 Some97.8mg115 mg / 100 g
- 34
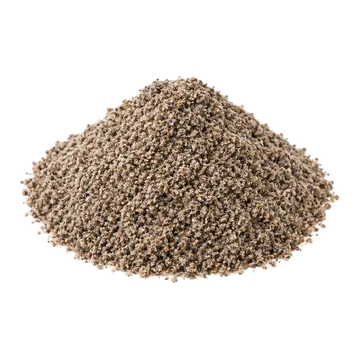 A little94.7mg631 mg / 100 g
- 35Tempeh85 g · US food database (USDA SR Legacy)11% of 1,000 mg, once its calcium is counted as milk’s (109 mg); 9% on the listed amount aloneSome, allowing for absorption94.4mg111 mg / 100 g
- 36Soybeans, cooked91 g · US food database (USDA SR Legacy)9% of 1,000 mg, once its calcium is counted as milk’s (89.5 mg); 9% on the listed amount aloneA little, allowing for absorption92.7mg102 mg / 100 g
- 37
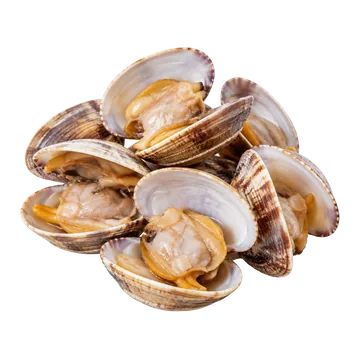 A little92mg92 mg / 100 g
- 38
 A little91mg91 mg / 100 g
- 39
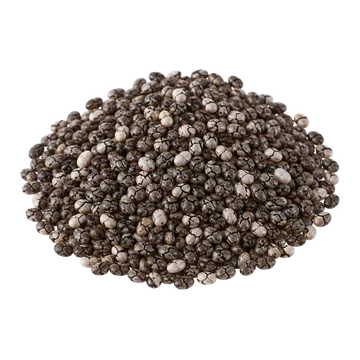 A little89.3mg595.4 mg / 100 g
- 40
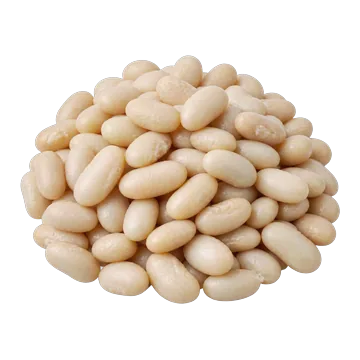 A little85.1mg90 mg / 100 g
- 41
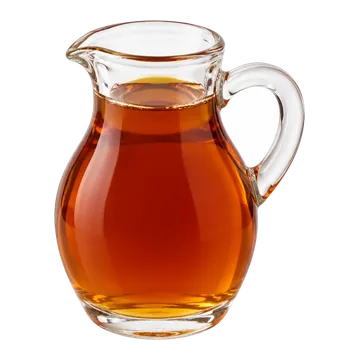 A little81.5mg102 mg / 100 g
- 42
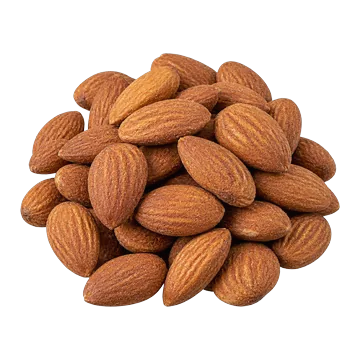 A little80.4mg268 mg / 100 g
- 43
 A little76.5mg255 mg / 100 g
- 44
 A little76.1mg253.6 mg / 100 g
- 45
 A little75.6mg189 mg / 100 g
- 46
 A little73.8mg59 mg / 100 g
- 47
 A little72.6mg66 mg / 100 g
- 48
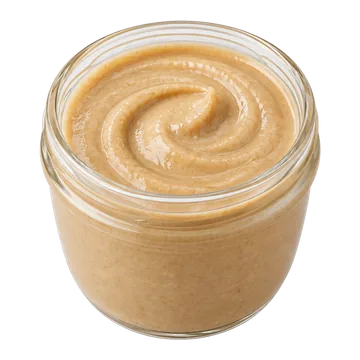 A little63.9mg426 mg / 100 g
- 49
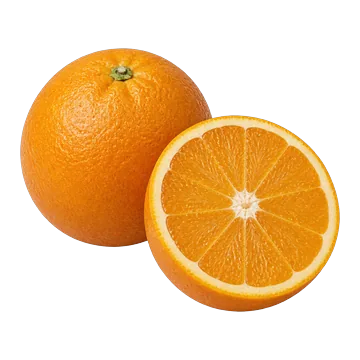 A little60.2mg43 mg / 100 g
- 50Spinach, raw85 g · US food database (USDA Foundation Foods)1% of 1,000 mg, once its calcium is counted as milk’s (8.99 mg); 6% on the listed amount aloneAlmost none, allowing for absorption56.6mg66.64 mg / 100 g
- 51
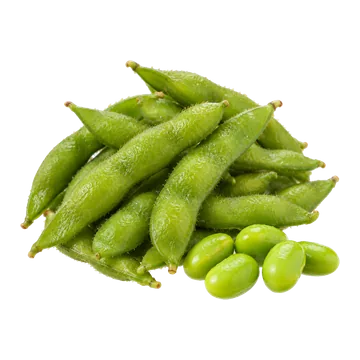 A little53.6mg63 mg / 100 g
- 52
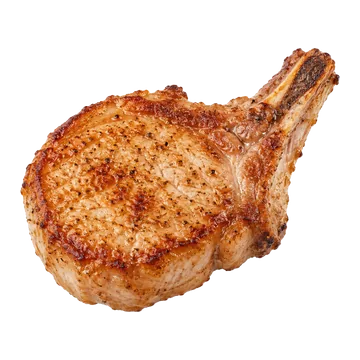 A little53mg53 mg / 100 g
- 53
 A little53mg106 mg / 100 g
- 54Bok choy, raw85 g · US food database (USDA Foundation Foods)9% of 1,000 mg, once its calcium is counted as milk’s (85 mg); 5% on the listed amount aloneA little, allowing for absorption52.6mg61.93 mg / 100 g
- 55
 A little52.1mg347 mg / 100 g
- 56
 A little51.8mg37 mg / 100 g
- 57
 A little50.3mg167.8 mg / 100 g
- 58
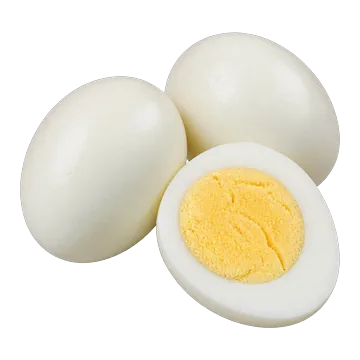 A little50mg50 mg / 100 g
- 59
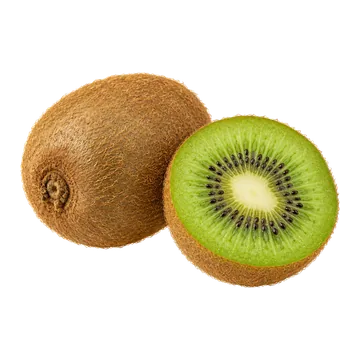 A little49mg35 mg / 100 g
- 60
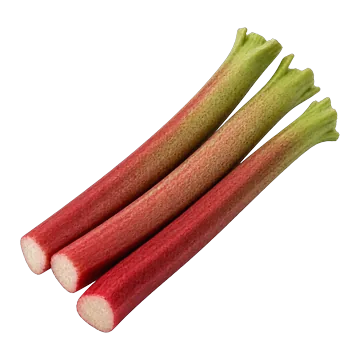 A little46.1mg32.93 mg / 100 g
- 61Corn tortillas55 g · US food database (USDA SR Legacy)4% of 1,000 mg, once its calcium is counted as milk’s (44.5 mg); 4% on the listed amount aloneA little, allowing for absorption44.6mg81 mg / 100 g
- 62
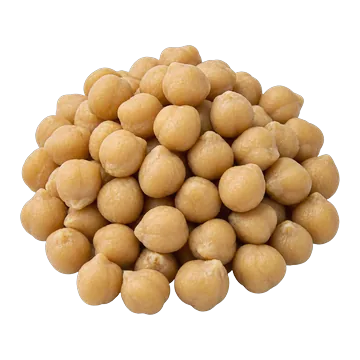 A little42.6mg49 mg / 100 g
- 63
 A little41.8mg38 mg / 100 g
- 64
 A little41.6mg46 mg / 100 g
- 65
 A little40.8mg48 mg / 100 g
- 66
 A little39.3mg46.28 mg / 100 g
- 67Broccoli, raw85 g · US food database (USDA Foundation Foods)6% of 1,000 mg, once its calcium is counted as milk’s (58.2 mg); 4% on the listed amount aloneA little, allowing for absorption39.1mg46 mg / 100 g
- 68Green beans, cooked85 g · US food database (USDA SR Legacy)3% of 1,000 mg, once its calcium is counted as milk’s (32.6 mg); 4% on the listed amount aloneA little, allowing for absorption37.4mg44 mg / 100 g
- 69
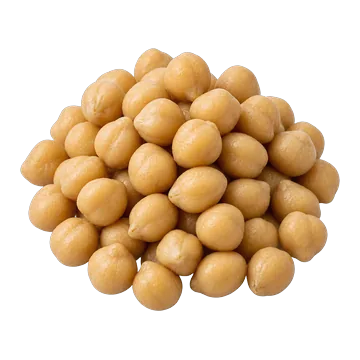 A little36.9mg45 mg / 100 g
- 70
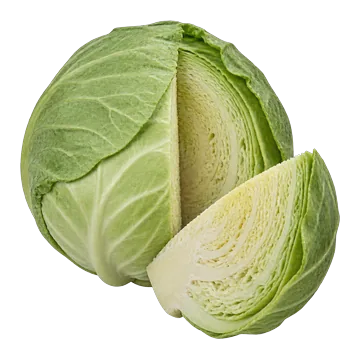 A little35.6mg41.84 mg / 100 g
- 71
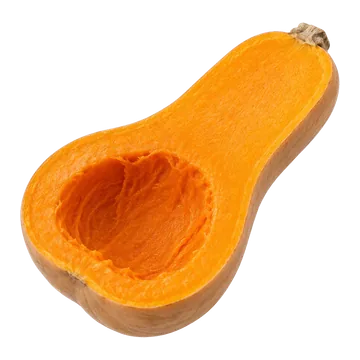 A little34.9mg41 mg / 100 g
- 72
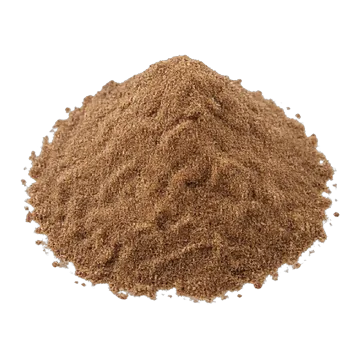 A little34.5mg229.9 mg / 100 g
- 73
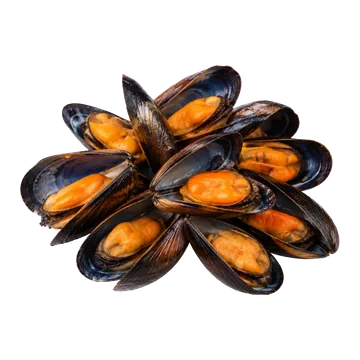 A little33mg33 mg / 100 g
- 74
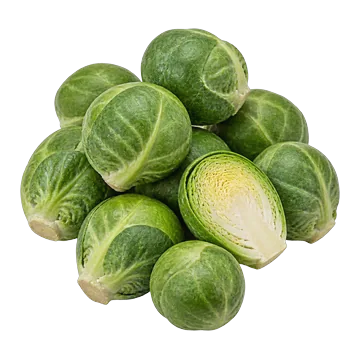 A little32.8mg38.64 mg / 100 g
- 75
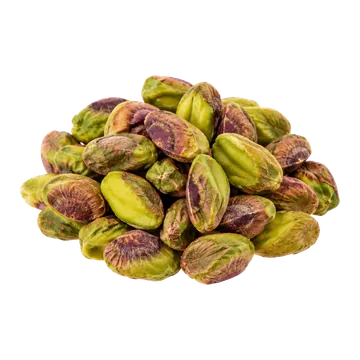 A little32.1mg107 mg / 100 g
- 76
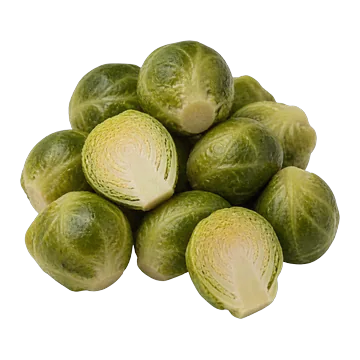 A little30.6mg36 mg / 100 g
- 77
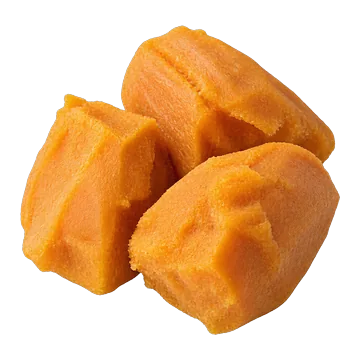 A little29.7mg27 mg / 100 g
- 78
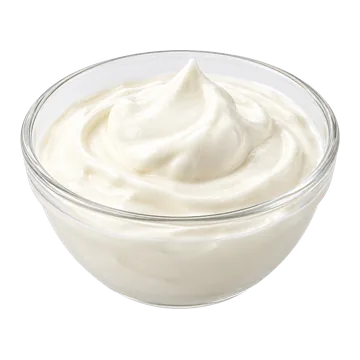 A little29.5mg101 mg / 100 g
- 79
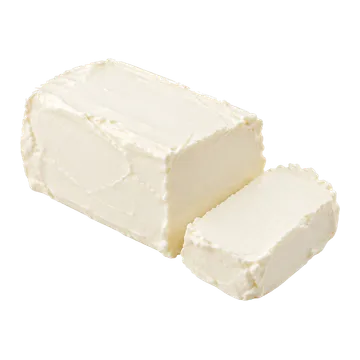 A little29.1mg97 mg / 100 g
- 80
 A little28.8mg11 mg / 100 g
- 81A little28.1mg33 mg / 100 g
- 82
 A little28mg13 mg / 100 g
- 83
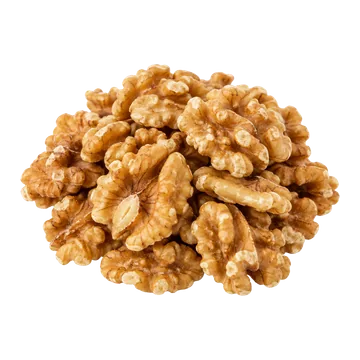 A little26.5mg88.26 mg / 100 g
- 84
 A little26.2mg29 mg / 100 g
- 85Carrots, raw85 g · US food database (USDA Foundation Foods)4% of 1,000 mg, once its calcium is counted as milk’s (42 mg); 3% on the listed amount aloneA little, allowing for absorption25.9mg30.48 mg / 100 g
- 86
 A little25.6mg64 mg / 100 g
- 87
 A little24.8mg19.83 mg / 100 g
- 88
 A little24.8mg45 mg / 100 g
- 89
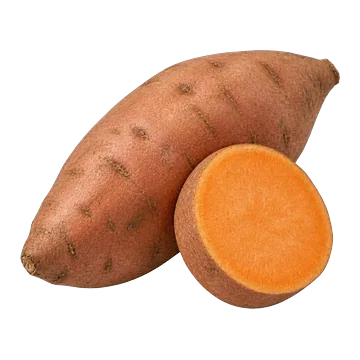 A little24.6mg22.33 mg / 100 g
- 90
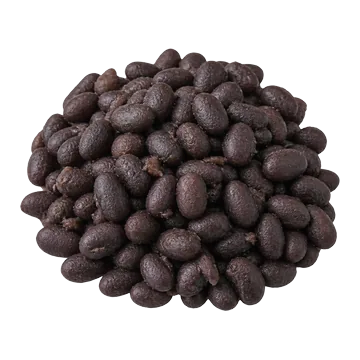 A little24.5mg27 mg / 100 g
- 91
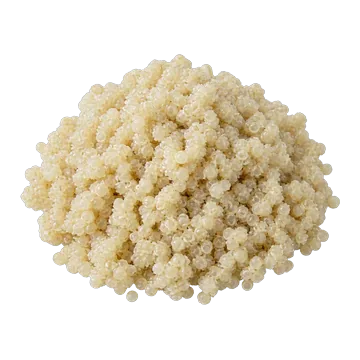 A little23.8mg17 mg / 100 g
- 92
 A little23.7mg16.9 mg / 100 g
- 93
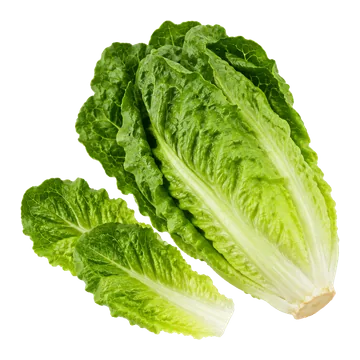 A little23.4mg27.56 mg / 100 g
- 94
 A little22.8mg57 mg / 100 g
- 95
 A little22.4mg16 mg / 100 g
- 96
 A little22.3mg9 mg / 100 g
- 97
 A little21mg70 mg / 100 g
- 98
 A little20.6mg51.49 mg / 100 g
- 99
 A little20.4mg24 mg / 100 g
- 100
 A little19.9mg19 mg / 100 g
- 101
 A little19.8mg18 mg / 100 g
- 102
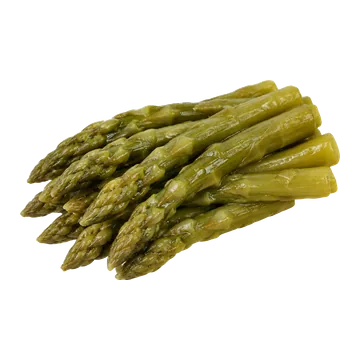 A little19.6mg23 mg / 100 g
- 103
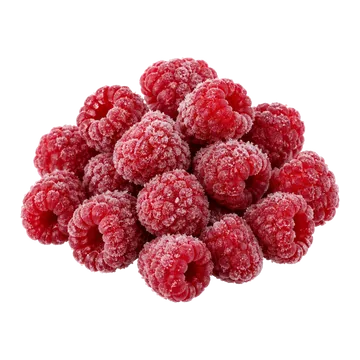 A little19.2mg24 mg / 100 g
- 104
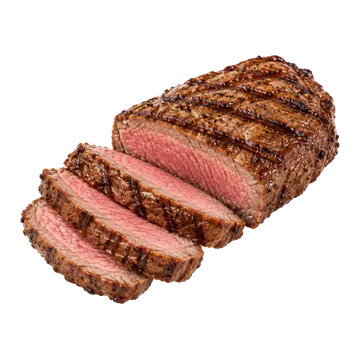 A little19mg19 mg / 100 g
- 105
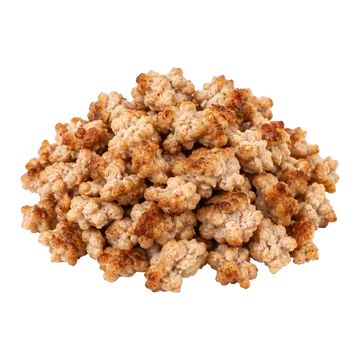 A little18.6mg31 mg / 100 g
- 106
 A little18mg60 mg / 100 g
- 107
 A little17.5mg12.5 mg / 100 g
- 108
 A little17.4mg58 mg / 100 g
- 109
 A little17.3mg20.35 mg / 100 g
- 110
 A little17.2mg12.26 mg / 100 g
- 111
 A little17mg20 mg / 100 g
- 112
 A little16.8mg28 mg / 100 g
- 113
 A little16.8mg12 mg / 100 g
- 114
 A little16.4mg107 mg / 100 g
- 115
 A little15.4mg11 mg / 100 g
- 116
 A little15.3mg18 mg / 100 g
- 117
 A little15.3mg18 mg / 100 g
- 118
 A little15mg15 mg / 100 g
- 119
 A little15mg15 mg / 100 g
- 120
 A little15mg15 mg / 100 g
- 121
 Almost none14.7mg49.13 mg / 100 g
- 122
 Almost none14.2mg10.17 mg / 100 g
- 123
 Almost none14.1mg47 mg / 100 g
- 124
 Almost none14mg14 mg / 100 g
- 125
 Almost none14mg10 mg / 100 g
- 126
 Almost none14mg14 mg / 100 g
- 127
 Almost none13.9mg16.34 mg / 100 g
- 128
 Almost none13.6mg16 mg / 100 g
- 129
 Almost none13.6mg17 mg / 100 g
- 130
 Almost none13.6mg16 mg / 100 g
- 131
 Almost none13.5mg9 mg / 100 g
- 132
 Almost none13.2mg24 mg / 100 g
- 133
 Almost none13.1mg16.41 mg / 100 g
- 134
 Almost none13mg13 mg / 100 g
- 135
 Almost none12.8mg15 mg / 100 g
- 136
 Almost none12.6mg18 mg / 100 g
- 137
 Almost none12.6mg9 mg / 100 g
- 138
 Almost none12.6mg41.95 mg / 100 g
- 139
 Almost none11.8mg7.86 mg / 100 g
- 140
 Almost none11.3mg3 mg / 100 g
- 141
 Almost none11.2mg37.38 mg / 100 g
- 142
 Almost none11mg11 mg / 100 g
- 143Almost none10mg8 mg / 100 g
- 144Almost none9.97mg66 mg / 100 g
- 145
 Almost none9.9mg18 mg / 100 g
- 146
 Almost none9.35mg11.69 mg / 100 g
- 147
 Almost none9mg30 mg / 100 g
- 148
 Almost none8.8mg8 mg / 100 g
- 149
 Almost none8.51mg28 mg / 100 g
- 150
 Almost none8.47mg9.96 mg / 100 g
- 151Almost none8.4mg12 mg / 100 g
- 152
 Almost none8.37mg5.98 mg / 100 g
- 153Almost none7.7mg14 mg / 100 g
- 154
 Almost none7.7mg14 mg / 100 g
- 155
 Almost none7.35mg49 mg / 100 g
- 156
 Almost none7.24mg181 mg / 100 g
- 157
 Almost none7mg5 mg / 100 g
- 158
 Almost none6.4mg8 mg / 100 g
- 159
 Almost none6.37mg7.5 mg / 100 g
- 160
 Almost none6mg6 mg / 100 g
- 161
 Almost none5.95mg7 mg / 100 g
- 162
 Almost none5.6mg4 mg / 100 g
- 163
 Almost none5.28mg33 mg / 100 g
- 164
 Almost none5.1mg6 mg / 100 g
- 165
 Almost none5mg2 mg / 100 g
- 166Almost none5mg2 mg / 100 g
- 167
 Almost none4.95mg9 mg / 100 g
- 168
 Almost none4.65mg5.47 mg / 100 g
- 169
 Almost none4.34mg14.46 mg / 100 g
- 170
 Almost none4.2mg3 mg / 100 g
- 171
 Almost none3.91mg1 mg / 100 g
- 172
 Almost none3.63mg9.07 mg / 100 g
- 173
 Almost none3.5mg7 mg / 100 g
- 174
 Almost none2.55mg3 mg / 100 g
- 175Almost none2.55mg3 mg / 100 g
- 176
 Almost none2.4mg24 mg / 100 g
- 177Almost none2.4mg24 mg / 100 g
- 178
 Almost none1.65mg11 mg / 100 g
- 179
 Almost none1.2mg6 mg / 100 g
- 180
 Almost none1.12mg8 mg / 100 g
- 181
 Almost none0.91mg6 mg / 100 g
- 182
 Almost none0.6mg2 mg / 100 g
- 183
 Almost none0.31mg6 mg / 100 g
- 184
 Almost none0.1mg1 mg / 100 g
- 185
 Almost none0.09mg1 mg / 100 g
- 186
 Almost none0.04mg2 mg / 100 g
- 187
 Almost none0mg0 mg / 100 g
- 188
 Almost none0mg0 mg / 100 g
- 189
 Almost none0mg0 mg / 100 g
- 190Almost none0mg0 mg / 100 g
- 191Almost none0mg0 mg / 100 g
Not ranked in this view
These list Calcium but have no serving size on file yet.
Not listed
The databases don’t list Calcium for these foods: left out, not counted as zero.
Not yet reviewed · shown per 100 g, not per serving
Straight from the national databases, not yet checked, so not ranked. The list can include dried foods, spices and fortified products that a review would set aside.
No serving size yet, so shown per 100 g, even under “per serving”.
Not compared with the upper level: with no serving size, a figure for 100 g of a powder or a concentrate says nothing about what anyone eats. Choose an amount under “per 100 g” to compare one.
- Leavening agents, baking powder, double-acting, straight phosphate · US food database (USDA SR Legacy)7,364 mgper 100 g
- Leavening agents, baking powder, double-acting, sodium aluminum sulfate · US food database (USDA SR Legacy)5,876 mgper 100 g
- Leavening agents, baking powder, low-sodium · US food database (USDA SR Legacy)4,332 mgper 100 g
- Desserts, rennin, tablets, unsweetened · US food database (USDA SR Legacy)3,733 mgper 100 g
- Spices, basil, dried · US food database (USDA SR Legacy)2,240 mgper 100 g
- Tofu, dried-frozen (koyadofu), prepared with calcium sulfate · US food database (USDA SR Legacy)2,134 mgper 100 g
- Spices, savory, ground · US food database (USDA SR Legacy)2,132 mgper 100 g
- Whey, acid, dried · US food database (USDA SR Legacy)2,054 mgper 100 g
- Spices, marjoram, dried · US food database (USDA SR Legacy)1,990 mgper 100 g
- Spices, thyme, dried · US food database (USDA SR Legacy)1,890 mgper 100 g
- Spices, dill weed, dried · US food database (USDA SR Legacy)1,784 mgper 100 g
- Spices, celery seed · US food database (USDA SR Legacy)1,767 mgper 100 g
- Babyfood, cereal, soya, with fruit, dry · Canadian Nutrient File 20261,738 mgper 100 g
- Spices, sage, ground · US food database (USDA SR Legacy)1,652 mgper 100 g
- Seeds, sisymbrium sp. seeds, whole, dried · US food database (USDA SR Legacy)1,633 mgper 100 g
- Babyfood, snack, biscuit, mixed grain · Canadian Nutrient File 20261,613 mgper 100 g
- Smelt, dried (Alaska Native) · US food database (USDA SR Legacy)1,600 mgper 100 g
- Spices, oregano, dried · US food database (USDA SR Legacy)1,597 mgper 100 g
- Spices, dill seed · US food database (USDA SR Legacy)1,516 mgper 100 g
- Cheese, pasteurized process cheese food or product, American, singles · US food database (USDA Foundation Foods)1,498 mgper 100 g
Ranked as eaten. Where a food is also listed in a form people eat, these forms are left out: raw meat, poultry, fish and eggs (their cooked forms are ranked), dry grains and legumes, and frozen vegetables before cooking. Raw oysters stay: they have no other form.
Which 19 are left out?
- raw ground beef
- Beef liver, raw
- Beef steak, top loin, raw
- raw chicken breast
- Chicken thigh, raw
- Chicken liver, raw
- Cod, raw
- raw eggs
- dry lentils
- raw mackerel
- dry rolled oats
- dry pasta
- dry whole-wheat pasta
- frozen peas
- Pork chop, raw
- Pork sausage, raw
- dry quinoa
- raw farmed salmon
- Ground turkey, 93% lean, raw
12 fortified foods are left out: makers add vitamins and minerals in amounts that vary by brand, so check the label for calcium: Almond drink, unsweetened, fortified · Oat drink, unsweetened, fortified · Soy drink, unsweetened, fortified · White bread · White bread, toasted · Cakes · Crackers · Flour tortillas · Pasta, cooked · Pies · Cookies · Breakfast cereal
Running low, and too much
Running low
Too little calcium over years can lead to osteoporosis: weak, fragile bones and a higher risk of falls and fractures. Postmenopausal women and people who avoid dairy are more likely to fall short.
Too much
Calcium supplements might raise the risk of kidney stones, and by some research of heart disease. The upper level is 2,500 mg a day for adults 19 to 50, and 2,000 mg from age 51.
Sources: NIH Office of Dietary Supplements, calcium fact sheet for health professionals (2026-06-22) · Upper levels (adults 19–30): Health Canada, Dietary reference intakes tables: elements (2025-11-19)