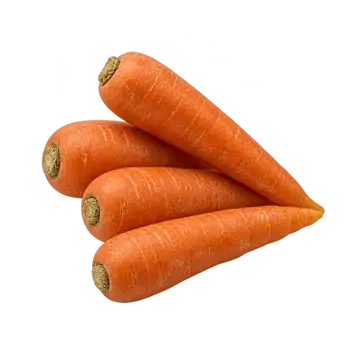
Carrots, raw
Checked by us One serving: 85 g (about 1½ medium carrots) · 38 kcal
Lots of vitamin A.
Nothing to watch.
Good for
How we counted this
What one serving (85 g) gives you.
Your body needs enough of each of these. Past enough, more doesn’t help. Amounts are what the food databases list, not what your body absorbs, unless a row says it was measured.
The words: “A lot” means one serving gives 20% or more of Health Canada’s daily amount, “Some” 10% to 19%, “A little” 2% to 9%, “Almost none” under 2%. Strongest word first; within a word, protein and fibre lead, then the biggest share. ?
A milligram (mg) is a thousandth of a gram, and a microgram (µg) a thousandth of a milligram: 1,000 µg make 1 mg.
- A lot
Vitamin A
Your eyes need it to see in dim light.
Learn more
Getting enough matters; more than enough doesn’t sharpen your sight.
710 µg in one serving: 79% of the 900 µg a day men need, 101% of the 700 µg women need. The word follows the smaller share, which is the share of the higher amount. ?
Source: How much of it gets in hasn’t been measured for this food yet. NIH Office of Dietary Supplements, vitamin A fact sheet for health professionals
21 more nutrients below “a lot”
- A little
Vitamin B6
Helps you use protein, and your brain needs it to make its chemical messengers.
Learn more
0.12 mg in one serving: 9% of the 1.3 mg a day.
Source: How much of it gets in hasn’t been measured for this food yet. NIH Office of Dietary Supplements, vitamin B6 fact sheet for health professionals
- A little
Vitamin K1
Your blood needs it to clot.
Learn more
11.2 µg in one serving: 9% of the 120 µg a day men need, 12% of the 90 µg women need. The word follows the smaller share, which is the share of the higher amount. ?
Source: How much of it gets in hasn’t been measured for this food yet. NIH Office of Dietary Supplements, vitamin K fact sheet for health professionals
- A little
Folate
Your body needs it to make DNA and to divide new cells.
Learn more
31.5 µg in one serving: 8% of the 400 µg a day.
Source: How much of it gets in hasn’t been measured for this food yet. NIH Office of Dietary Supplements, folate fact sheet for health professionals
- A little
Potassium
Your nerves, muscles and kidneys need it to work.
Learn more
238 mg in one serving: 7% of the 3,400 mg a day men need, 9% of the 2,600 mg women need. The word follows the smaller share, which is the share of the higher amount. ?
Source: How much of it gets in hasn’t been measured for this food yet. NIH Office of Dietary Supplements, potassium fact sheet for health professionals
- A little
Fibre
Keeps your gut moving.
Learn more
2.63 g in one serving: 7% of the 38 g a day men need, 11% of the 25 g women need. The word follows the smaller share, which is the share of the higher amount. ?
Source: How much of it gets in hasn’t been measured for this food yet. Institute of Medicine 2005, Dietary Reference Intakes for Energy, Carbohydrate, Fiber, Fat, Fatty Acids, Cholesterol, Protein, and Amino Acids
- A little
Niacin (B3, niacin equivalents)
More than 400 of your enzymes need it to work.
Learn more
1.01 mg in one serving: 6% of the 16 mg a day men need, 7% of the 14 mg women need. The word follows the smaller share, which is the share of the higher amount. ?
Source: How much of it gets in hasn’t been measured for this food yet. NIH Office of Dietary Supplements, niacin fact sheet for health professionals
- A little
Riboflavin (B2)
Your cells use it to make energy and handle fats. It also helps turn tryptophan into niacin and activate vitamin B6.
Learn more
0.08 mg in one serving: 6% of the 1.3 mg a day men need, 7% of the 1.1 mg women need. The word follows the smaller share, which is the share of the higher amount. ?
Source: How much of it gets in hasn’t been measured for this food yet. NIH Office of Dietary Supplements, riboflavin fact sheet for health professionals
- A little
Vitamin C
Your body makes collagen with it, which wounds need to heal. It also helps you absorb iron from plants.
Learn more
5.02 mg in one serving: 6% of the 90 mg a day men need, 7% of the 75 mg women need. The word follows the smaller share, which is the share of the higher amount. ?
Source: How much of it gets in hasn’t been measured for this food yet. NIH Office of Dietary Supplements, vitamin C fact sheet for health professionals
- A little
Thiamin (B1)
Your cells use it to get energy from food, and so to grow and work.
Learn more
0.06 mg in one serving: 5% of the 1.2 mg a day men need, 5% of the 1.1 mg women need. The word follows the smaller share, which is the share of the higher amount. ?
Source: How much of it gets in hasn’t been measured for this food yet. NIH Office of Dietary Supplements, thiamin fact sheet for health professionals
- A little
Calcium
Builds your bones and teeth.
The label says 25.9 mg of calcium. Your body gets about 13.5 mg.
From our evidence: Calcium on the label vs calcium absorbed →
Learn more
tested at 38 mg · Morris et al. 2008: control carrot · grade A
- 7Carrots, raw85 g · 52.1% gets in · tested at 38 mg ◇13mglabel 26
Listed: 25.9 mg. The word above is read from how well this calcium gets in compared with milk’s: 25.9 mg × 52.1% (gets in from this food) ÷ 32.1% (from milk) = 42 mg, counted as milk’s calcium, which is 4% of 1,000 mg a day.
Source: NIH Office of Dietary Supplements, calcium fact sheet for health professionals
- 7
- A little
Vitamin E
Shields the fats in your cells from damage; your immune system uses it too.
Learn more
0.56 mg in one serving: 4% of the 15 mg a day.
Source: How much of it gets in hasn’t been measured for this food yet. NIH Office of Dietary Supplements, vitamin E fact sheet for health professionals
- A little
Magnesium
Your muscles and nerves need it to work.
Learn more
10.6 mg in one serving: 3% of the 400 mg a day men need, 3% of the 310 mg women need. The word follows the smaller share, which is the share of the higher amount. ?
Source: How much of it gets in hasn’t been measured for this food yet. NIH Office of Dietary Supplements, magnesium fact sheet for health professionals
- A little
Zinc
Your immune system and healing wounds depend on it.
Learn more
0.2 mg in one serving: 2% of the 11 mg a day men need, 3% of the 8 mg women need. The word follows the smaller share, which is the share of the higher amount. ?
Source: How much of it gets in hasn’t been measured for this food yet. NIH Office of Dietary Supplements, zinc fact sheet for health professionals
- Almost none
Protein
Your muscles, and every other tissue, are built and repaired from it.
Learn more
0.8 g in one serving: 1% of the 56 g a day men need, 2% of the 46 g women need. The word follows the smaller share, which is the share of the higher amount. ?
Listed amount only. 1 absorption study of this nutrient is on file for this food, but none is quoted yet. Each one is in The numbers, with the reason. See the studies
- Almost none
Choline
Your cells need it for their membranes, and to make acetylcholine, a messenger for memory, mood and muscle control.
Learn more
7.48 mg in one serving: 1% of the 550 mg a day men need, 2% of the 425 mg women need. The word follows the smaller share, which is the share of the higher amount. ?
Source: How much of it gets in hasn’t been measured for this food yet. NIH Office of Dietary Supplements, choline fact sheet for health professionals
- Almost none
Iron
Carries oxygen in your blood.
Learn more
0.13 mg in one serving: 2% of the 8 mg a day men need, 1% of the 18 mg women need. The word follows the smaller share, which is the share of the higher amount. ?
Listed amount only. 1 absorption study of this nutrient is on file for this food, but none is quoted yet. Each one is in The numbers, with the reason. See the studies
Source: NIH Office of Dietary Supplements, iron fact sheet for health professionals
- Almost none
Omega-3: ALA
The one omega-3 your body can’t make: it must come from food. Your cells build it into their membranes and burn it for energy.
Learn more
1.7 mg in one serving: under 1% of the 1,600 mg a day men need, under 1% of the 1,100 mg women need. The word follows the smaller share, which is the share of the higher amount. ?
Source: How much of it gets in hasn’t been measured for this food yet. NIH Office of Dietary Supplements, omega-3 fatty acids fact sheet for health professionals
- Almost none
Omega-3: EPA + DHA
Long-chain omega-3s, built into your cell membranes. DHA is concentrated in your brain and retinas.
Learn more
0 mg in one serving: under 1% of the 250 mg a day.
Health Canada sets no daily amount for these fats, so the daily figure here is the European Food Safety Authority’s.
Source: How much of it gets in hasn’t been measured for this food yet. NIH Office of Dietary Supplements, omega-3 fatty acids fact sheet for health professionals
- Almost none
Selenium
Your thyroid uses it to make its hormones.
Learn more
0 µg in one serving: under 1% of the 55 µg a day.
Source: How much of it gets in hasn’t been measured for this food yet. NIH Office of Dietary Supplements, selenium fact sheet for health professionals
- Almost none
Vitamin B12
Your body needs it to make red blood cells and keep nerves working.
Learn more
0 µg in one serving: under 1% of the 2.4 µg a day.
Source: How much of it gets in hasn’t been measured for this food yet. NIH Office of Dietary Supplements, vitamin B12 fact sheet for health professionals
- Almost none
Vitamin D
Your body needs it to absorb calcium and keep your bones hard.
Learn more
Your skin also makes it in sunlight, so food is only one of its sources.
0 µg in one serving: under 1% of the 15 µg a day.
Source: How much of it gets in hasn’t been measured for this food yet. NIH Office of Dietary Supplements, vitamin D fact sheet for health professionals
Watch out
How we counted this
Checked for cadmium and lead: fine at normal amounts.
Cadmium
Nothing to watchYou’d need about 4.7 servings a day, every day, of this food alone to use up what an average adult’s intake leaves under the limit.
Learn more
One serving carries 1.6 µg
How we got this
A serving a day adds 9% to what an average adult already takes in: a share of that intake, not of the limit. With that serving every day, an average adult would be at about 77% of the limit.
An average adult already takes in about 71% of the limit. One serving a day fits in the room left.
Counted from zero, with no allowance for what adults already take in from other food, 9,600 g a week would reach the limit.
Why this rating: Eating it daily comes to 595 g a week, which stays within the 2,800 g of room left before the limit.
The dataset’s rating: Nothing to watch: under the limit
A daily serving adds 9% to an average adult's cadmium intake (EFSA 2012 adult median, 1.77 µg/kg body weight/week; Canadian adults in 2007: 1.2-1.75), far from doubling it, so no cap.
Health Canada, Canadian Total Diet Study – Trace Elements (2005–2018 composites) · grade A
Lead
Nothing to watchYou’d need about 48 servings a day, every day, of this food alone to double the lead an average adult already gets. No dose is known to be safe, so doubling is where we flag.
Learn more
A serving a day adds 2.1% to what an average adult already takes in. There is no limit to take a share of.
One serving carries 0.73 µg
How we got this
The dataset’s rating: Nothing to watch: doesn’t double average intake
adds 2.1%
Health Canada, Canadian Total Diet Study – Trace Elements (2005–2018 composites) · grade A
Worth knowing
No limit applies, so none is rated.
Sugar
4 g of sugar in a 85 g serving, natural and added together.
Learn more
Shown, not rated. The food tables we read give total sugar, and few give added sugar, so the site can’t yet tell sugar added in making a food from the sugar in fruit or milk.
Also measured in it
Figures from the dataset. None has a limit to be rated against, so none is a verdict.
Oxalate: 16–49 mg per 100 g in the sources we hold. · Akhtar 2011 · grade A
We haven’t rated this food for oxalate. We count only a figure that comes from a grade A or B source and says it was measured per 100 g of the food as eaten, and none of the figures here does both.
Also checked (nothing to act on) · 1
Noted for context, or not measured in this food yet.
Context only: 10%
Better options
How we counted this
“Better” here always means better at something the row names: more of one nutrient, more nutrients per serving, or the goal you pick. It never means better in every way.
Every amount below is for the same weight, 85 g, the size of one serving of this food, so a swap compares like with like. A serving of another food can be bigger or smaller.
A food is listed only if it gives clearly more: at least a fifth more than this food, and at least 10% of the daily amount more.
More of what it’s good for
For vitamin A: no other vegetables or snacks we’ve checked give clearly more, in the same 85 g.
More nutrients per serving, counted together
The other vegetables or snacks we’ve checked with more nutrients per serving than this one, counting at most 100 kcal. One score ranks them all, so the same few often lead.
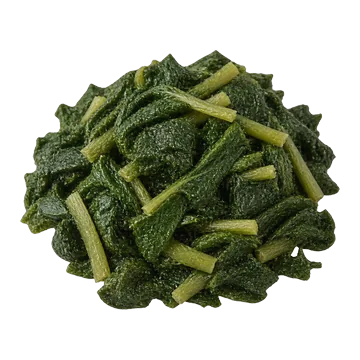 Turnip greens, cooked
- More vitamin K1 (312 µg vs 11.2 µg)
- More vitamin C (23.3 mg vs 5.02 mg)
- More folate (100 µg vs 31.5 µg)
- Less vitamin A (324 µg vs 710 µg)
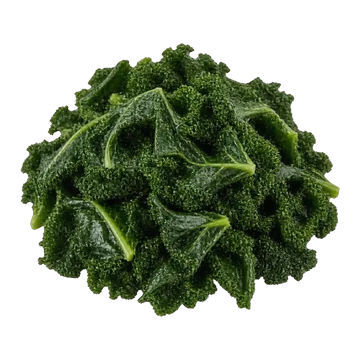 Kale, cooked
- More vitamin K1 (355 µg vs 11.2 µg)
- More omega-3: ALA (286 mg vs 1.7 mg)
- More calcium (52.1 mg vs 13.5 mg)
- Less vitamin A (124 µg vs 710 µg)
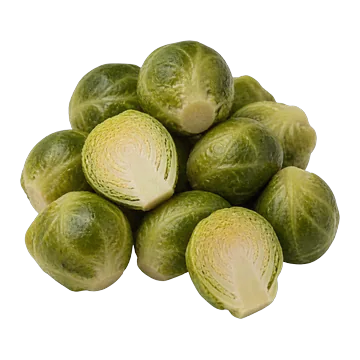 Brussels sprouts, cooked
- More vitamin K1 (119 µg vs 11.2 µg)
- More vitamin C (52.7 mg vs 5.02 mg)
- Less vitamin A (33.2 µg vs 710 µg)
Where the calcium card measured that less calcium gets in than from milk, calcium counts for less; everything else is as listed.
Your goal
Your goal changes only this list, not what the food gives you or what to watch.
Losing weight: fewer calories, and more nutrients, protein and fibre for each calorie.
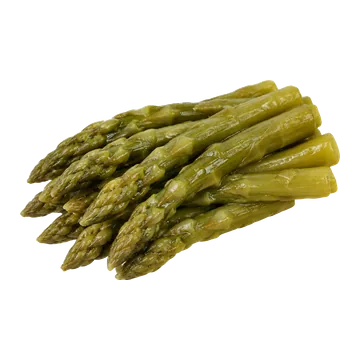 Asparagus, cooked
- 19 kcal in 85 g (this food: 38)
- More vitamin K1 (43 µg vs 11.2 µg)
- More folate (127 µg vs 31.5 µg)
- Less vitamin A (42.5 µg vs 710 µg)
- Turnip greens, cooked
- 17 kcal in 85 g (this food: 38)
- More vitamin K1 (312 µg vs 11.2 µg)
- More vitamin C (23.3 mg vs 5.02 mg)
- More folate (100 µg vs 31.5 µg)
- Less vitamin A (324 µg vs 710 µg)
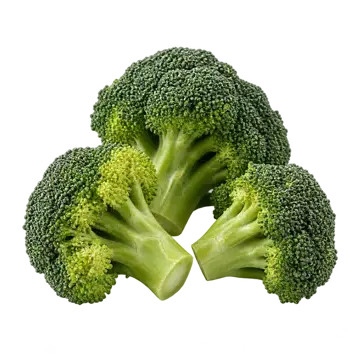 Broccoli, cooked
- 24 kcal in 85 g (this food: 38)
- More vitamin K1 (74.9 µg vs 11.2 µg)
- More vitamin C (34.1 mg vs 5.02 mg)
- Less vitamin A (43.4 µg vs 710 µg)
Building muscle: more protein and more calories, per 100 g.
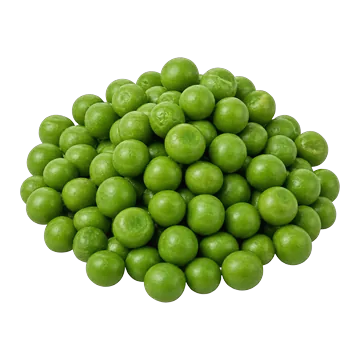 Green peas, cooked5.2 g protein · 78 kcal per 100 g
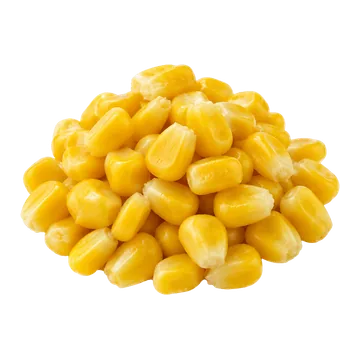 Sweet corn, frozen, cooked2.6 g protein · 81 kcal per 100 gNeeds care in handling: see its page
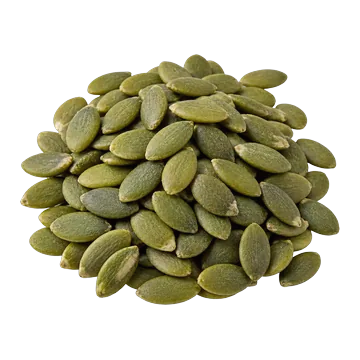 Pumpkin seeds29.9 g protein · 515 kcal per 100 g
Why some foods aren’t suggested
Left out: Spinach, cooked (Cadmium: go easy · lots of oxalate, more than its own calcium can bind).
Left out: Edamame, cooked (not tested for contaminants yet).
Bring a tracker export or describe your usual week. The same rules check all of it.
The numbers
Open every value
Name in the database: Carrot, raw
How the serving was set: 85 g (Health Canada V.1)
Listed nutrients, per 100 g
For each nutrient, the value this page uses is marked “used”. A row marked “second database” is another database’s figure for a matching food, kept so you can see how far databases disagree (they can differ in the samples analysed, lab methods and rounding). Its own cells are worked out from it, but none of the page’s words or scores are.
| Nutrient | Per serving | Per 100 calories | How | Source | Grade | |
|---|---|---|---|---|---|---|
| Omega-3: ALA | 0.002 g | 0 g | 0 g | from SR Legacy used | US food database (USDA SR Legacy) #170393 | C |
| Calcium | 30.48 mg | 25.91 mg | 67.77 mg | listed used | US food database (USDA Foundation Foods) #2258586 | C |
| 26 mg | 22.1 mg | 57.81 mg | second database · not used | UK food tables (CoFID 2021) #13-496 | C | |
| 33 mg | 28.05 mg | 73.37 mg | copy of USDA · not used | Canadian Nutrient File 2026 #2380 | C | |
| Carbohydrate | 10.268 g | 8.73 g | 22.83 g | listed used | US food database (USDA Foundation Foods) #2258586 | C |
| Choline | 8.8 mg | 7.48 mg | 19.56 mg | from SR Legacy used | US food database (USDA SR Legacy) #170393 | C |
| Energy | 44.979 kcal | 38.23 kcal | – | FDC Energy (Atwater Specific Factors) used | US food database (USDA Foundation Foods) | – |
| 41 kcal | 34.85 kcal | – | from SR Legacy · not used | US food database (USDA SR Legacy) #170393 | C | |
| Omega-3: EPA + DHA | 0 g | 0 g | 0 g | from SR Legacy used | US food database (USDA SR Legacy) #170393 | C |
| Fat | 0.351 g | 0.3 g | 0.78 g | listed used | US food database (USDA Foundation Foods) #2258586 | C |
| 0.4 g | 0.34 g | 0.89 g | second database · not used | UK food tables (CoFID 2021) #13-496 | C | |
| Cholesterol | 0 mg | 0 mg | 0 mg | from SR Legacy used | US food database (USDA SR Legacy) #170393 | C |
| Fatty acids, total saturated | 0.032 g | 0.03 g | 0.07 g | from SR Legacy used | US food database (USDA SR Legacy) #170393 | C |
| Fibre | 3.095 g | 2.63 g | 6.88 g | listed used | US food database (USDA Foundation Foods) #2258586 | C |
| 3.9 g | 3.32 g | 8.67 g | second database · not used | UK food tables (CoFID 2021) #13-496 | C | |
| Folate | 37.06 µg | 31.5 µg | 82.39 µg | listed used | US food database (USDA Foundation Foods) #2258586 | C |
| 8 µg | 6.8 µg | 17.79 µg | second database · not used · 4.6× | UK food tables (CoFID 2021) #13-496 | C | |
| Iron | 0.15 mg | 0.13 mg | 0.33 mg | listed used | US food database (USDA Foundation Foods) #2258586 | C |
| 0.23 mg | 0.2 mg | 0.51 mg | second database · not used | UK food tables (CoFID 2021) #13-496 | C | |
| Magnesium | 12.45 mg | 10.58 mg | 27.68 mg | listed used | US food database (USDA Foundation Foods) #2258586 | C |
| 7 mg | 5.95 mg | 15.56 mg | second database · not used | UK food tables (CoFID 2021) #13-496 | C | |
| Niacin (B3, niacin equivalents) | 1.183 mg | 1.01 mg | 2.63 mg | listed used | Canadian Nutrient File 2026 #2380 | C |
| Phosphorus | 39.81 mg | 33.84 mg | 88.51 mg | listed used | US food database (USDA Foundation Foods) #2258586 | C |
| 16 mg | 13.6 mg | 35.57 mg | second database · not used · 2.5× | UK food tables (CoFID 2021) #13-496 | C | |
| Potassium | 279.6 mg | 237.66 mg | 621.63 mg | listed used | US food database (USDA Foundation Foods) #2258586 | C |
| 178 mg | 151.3 mg | 395.74 mg | second database · not used | UK food tables (CoFID 2021) #13-496 | C | |
| Protein | 0.941 g | 0.8 g | 2.09 g | listed used | US food database (USDA Foundation Foods) #2258586 | C |
| 0.5 g | 0.43 g | 1.11 g | second database · not used | UK food tables (CoFID 2021) #13-496 | C | |
| Riboflavin (B2) | 0.095 mg | 0.08 mg | 0.21 mg | listed used | US food database (USDA Foundation Foods) #2258586 | C |
| 0.01 mg | 0.01 mg | 0.02 mg | second database · not used · 9.5× | UK food tables (CoFID 2021) #13-496 | C | |
| Selenium | 0 µg | 0 µg | 0 µg | listed used | US food database (USDA Foundation Foods) #2258586 | C |
| Sodium | 86.65 mg | 73.65 mg | 192.65 mg | listed used | US food database (USDA Foundation Foods) #2258586 | C |
| 27 mg | 22.95 mg | 60.03 mg | second database · not used · 3.2× | UK food tables (CoFID 2021) #13-496 | C | |
| Sugars | 4.74 g | 4.03 g | 10.54 g | from SR Legacy used | US food database (USDA SR Legacy) #170393 | C |
| 7.2 g | 6.12 g | 16.01 g | second database · not used | UK food tables (CoFID 2021) #13-496 | C | |
| Thiamin (B1) | 0.065 mg | 0.06 mg | 0.14 mg | listed used | US food database (USDA Foundation Foods) #2258586 | C |
| 0.13 mg | 0.11 mg | 0.29 mg | second database · not used · 2× | UK food tables (CoFID 2021) #13-496 | C | |
| Vitamin A | 835 µg | 709.75 µg | 1,856.44 µg | from SR Legacy used | US food database (USDA SR Legacy) #170393 | C |
| Vitamin B12 | 0 µg | 0 µg | 0 µg | from SR Legacy used | US food database (USDA SR Legacy) #170393 | C |
| 0 µg | 0 µg | 0 µg | second database · not used | UK food tables (CoFID 2021) #13-496 | C | |
| Vitamin B6 | 0.146 mg | 0.12 mg | 0.32 mg | listed used | US food database (USDA Foundation Foods) #2258586 | C |
| 0.06 mg | 0.05 mg | 0.13 mg | second database · not used · 2.4× | UK food tables (CoFID 2021) #13-496 | C | |
| Vitamin C | 5.9 mg | 5.02 mg | 13.12 mg | from SR Legacy used | US food database (USDA SR Legacy) #170393 | C |
| 2 mg | 1.7 mg | 4.45 mg | second database · not used · 3× | UK food tables (CoFID 2021) #13-496 | C | |
| Vitamin D | 0 µg | 0 µg | 0 µg | from SR Legacy used | US food database (USDA SR Legacy) #170393 | C |
| 0 µg | 0 µg | 0 µg | second database · not used | UK food tables (CoFID 2021) #13-496 | C | |
| Vitamin E | 0.66 mg | 0.56 mg | 1.47 mg | from SR Legacy used | US food database (USDA SR Legacy) #170393 | C |
| 0.09 mg | 0.08 mg | 0.2 mg | second database · not used · 7.3× | UK food tables (CoFID 2021) #13-496 | C | |
| Vitamin K1 | 13.2 µg | 11.22 µg | 29.35 µg | from SR Legacy used | US food database (USDA SR Legacy) #170393 | C |
| 5.5 µg | 4.68 µg | 12.23 µg | second database · not used · 2.4× | UK food tables (CoFID 2021) #13-496 | C | |
| Water | 87.72 g | 74.56 g | 195.03 g | listed used | US food database (USDA Foundation Foods) #2258586 | C |
| 89 g | 75.65 g | 197.87 g | second database · not used | UK food tables (CoFID 2021) #13-496 | C | |
| Zinc | 0.236 mg | 0.2 mg | 0.53 mg | listed used | US food database (USDA Foundation Foods) #2258586 | C |
| 0.1 mg | 0.09 mg | 0.22 mg | second database · not used · 2.4× | UK food tables (CoFID 2021) #13-496 | C |
| Nutrient | Per 100 g | Per serving | Per 100 calories | How | Source | Grade |
|---|---|---|---|---|---|---|
| Beta-carotene | 8,285 µg | 7,042.25 µg | 18,419.88 µg | from SR Legacy used | US food database (USDA SR Legacy) #170393 | C |
| 9,149 µg | 7,776.65 µg | 20,340.79 µg | second database · not used | UK food tables (CoFID 2021) #13-496 | C | |
| Copper | 0.061 mg | 0.05 mg | 0.14 mg | listed used | US food database (USDA Foundation Foods) #2258586 | C |
| 0.03 mg | 0.03 mg | 0.07 mg | second database · not used · 2× | UK food tables (CoFID 2021) #13-496 | C | |
| Energy (Atwater general) | 47.991 kcal | 40.79 kcal | 106.7 kcal | listed used | US food database (USDA Foundation Foods) #2258586 | C |
| Energy (Atwater specific) | 44.979 kcal | 38.23 kcal | 100 kcal | listed used | US food database (USDA Foundation Foods) #2258586 | C |
| Nitrogen | 0.151 g | 0.13 g | 0.33 g | listed used | US food database (USDA Foundation Foods) #2258586 | C |
| Ash | 0.721 g | 0.61 g | 1.6 g | listed used | US food database (USDA Foundation Foods) #2258586 | C |
| Starch | 1.43 g | 1.22 g | 3.18 g | from SR Legacy used | US food database (USDA SR Legacy) #170393 | C |
| Sucrose | 3.59 g | 3.05 g | 7.98 g | from SR Legacy used | US food database (USDA SR Legacy) #170393 | C |
| Glucose | 0.59 g | 0.5 g | 1.31 g | from SR Legacy used | US food database (USDA SR Legacy) #170393 | C |
| Fructose | 0.55 g | 0.47 g | 1.22 g | from SR Legacy used | US food database (USDA SR Legacy) #170393 | C |
| Maltose | 0 g | 0 g | 0 g | from SR Legacy used | US food database (USDA SR Legacy) #170393 | C |
| Alcohol, ethyl | 0 g | 0 g | 0 g | from SR Legacy used | US food database (USDA SR Legacy) #170393 | C |
| Caffeine | 0 mg | 0 mg | 0 mg | from SR Legacy used | US food database (USDA SR Legacy) #170393 | C |
| Theobromine | 0 mg | 0 mg | 0 mg | from SR Legacy used | US food database (USDA SR Legacy) #170393 | C |
| Energy | 173 kj | 147.05 kj | 384.63 kj | from SR Legacy used | US food database (USDA SR Legacy) #170393 | C |
| Galactose | 0 g | 0 g | 0 g | from SR Legacy used | US food database (USDA SR Legacy) #170393 | C |
| Fluoride, F | 3.2 µg | 2.72 µg | 7.11 µg | from SR Legacy used | US food database (USDA SR Legacy) #170393 | C |
| Vitamin A, IU | 16,706 iu | 14,200.1 iu | 37,142.12 iu | from SR Legacy used | US food database (USDA SR Legacy) #170393 | C |
| Carotene, alpha | 3,477 µg | 2,955.45 µg | 7,730.34 µg | from SR Legacy used | US food database (USDA SR Legacy) #170393 | C |
| Vitamin D (D2 + D3), International Units | 0 iu | 0 iu | 0 iu | from SR Legacy used | US food database (USDA SR Legacy) #170393 | C |
| Cryptoxanthin, beta | 0 µg | 0 µg | 0 µg | from SR Legacy used | US food database (USDA SR Legacy) #170393 | C |
| Lycopene | 1 µg | 0.85 µg | 2.22 µg | from SR Legacy used | US food database (USDA SR Legacy) #170393 | C |
| Tocopherol, beta | 0.01 mg | 0.01 mg | 0.02 mg | from SR Legacy used | US food database (USDA SR Legacy) #170393 | C |
| Tocopherol, gamma | 0 mg | 0 mg | 0 mg | from SR Legacy used | US food database (USDA SR Legacy) #170393 | C |
| Tocopherol, delta | 0 mg | 0 mg | 0 mg | from SR Legacy used | US food database (USDA SR Legacy) #170393 | C |
| Tocotrienol, alpha | 0.01 mg | 0.01 mg | 0.02 mg | from SR Legacy used | US food database (USDA SR Legacy) #170393 | C |
| Tocotrienol, beta | 0 mg | 0 mg | 0 mg | from SR Legacy used | US food database (USDA SR Legacy) #170393 | C |
| Tocotrienol, gamma | 0 mg | 0 mg | 0 mg | from SR Legacy used | US food database (USDA SR Legacy) #170393 | C |
| Tocotrienol, delta | 0 mg | 0 mg | 0 mg | from SR Legacy used | US food database (USDA SR Legacy) #170393 | C |
| Biotin | 2.22 µg | 1.89 µg | 4.94 µg | listed used | US food database (USDA Foundation Foods) #2258586 | C |
| Vitamin K (Dihydrophylloquinone) | 0 µg | 0 µg | 0 µg | from SR Legacy used | US food database (USDA SR Legacy) #170393 | C |
| Folic acid | 0 µg | 0 µg | 0 µg | from SR Legacy used | US food database (USDA SR Legacy) #170393 | C |
| Folate, food | 19 µg | 16.15 µg | 42.24 µg | from SR Legacy used | US food database (USDA SR Legacy) #170393 | C |
| Folate, DFE | 19 µg | 16.15 µg | 42.24 µg | from SR Legacy used | US food database (USDA SR Legacy) #170393 | C |
| Betaine | 0.4 mg | 0.34 mg | 0.89 mg | from SR Legacy used | US food database (USDA SR Legacy) #170393 | C |
| Tryptophan | 0.012 g | 0.01 g | 0.03 g | from SR Legacy used | US food database (USDA SR Legacy) #170393 | C |
| Threonine | 0.191 g | 0.16 g | 0.42 g | from SR Legacy used | US food database (USDA SR Legacy) #170393 | C |
| Isoleucine | 0.077 g | 0.07 g | 0.17 g | from SR Legacy used | US food database (USDA SR Legacy) #170393 | C |
| Leucine | 0.102 g | 0.09 g | 0.23 g | from SR Legacy used | US food database (USDA SR Legacy) #170393 | C |
| Lysine | 0.101 g | 0.09 g | 0.22 g | from SR Legacy used | US food database (USDA SR Legacy) #170393 | C |
| Methionine | 0.02 g | 0.02 g | 0.04 g | from SR Legacy used | US food database (USDA SR Legacy) #170393 | C |
| Cystine | 0.083 g | 0.07 g | 0.18 g | from SR Legacy used | US food database (USDA SR Legacy) #170393 | C |
| Phenylalanine | 0.061 g | 0.05 g | 0.14 g | from SR Legacy used | US food database (USDA SR Legacy) #170393 | C |
| Tyrosine | 0.043 g | 0.04 g | 0.1 g | from SR Legacy used | US food database (USDA SR Legacy) #170393 | C |
| Valine | 0.069 g | 0.06 g | 0.15 g | from SR Legacy used | US food database (USDA SR Legacy) #170393 | C |
| Arginine | 0.091 g | 0.08 g | 0.2 g | from SR Legacy used | US food database (USDA SR Legacy) #170393 | C |
| Histidine | 0.04 g | 0.03 g | 0.09 g | from SR Legacy used | US food database (USDA SR Legacy) #170393 | C |
| Alanine | 0.113 g | 0.1 g | 0.25 g | from SR Legacy used | US food database (USDA SR Legacy) #170393 | C |
| Aspartic acid | 0.19 g | 0.16 g | 0.42 g | from SR Legacy used | US food database (USDA SR Legacy) #170393 | C |
| Glutamic acid | 0.366 g | 0.31 g | 0.81 g | from SR Legacy used | US food database (USDA SR Legacy) #170393 | C |
| Glycine | 0.047 g | 0.04 g | 0.1 g | from SR Legacy used | US food database (USDA SR Legacy) #170393 | C |
| Proline | 0.054 g | 0.05 g | 0.12 g | from SR Legacy used | US food database (USDA SR Legacy) #170393 | C |
| Serine | 0.054 g | 0.05 g | 0.12 g | from SR Legacy used | US food database (USDA SR Legacy) #170393 | C |
| Vitamin E, added | 0 mg | 0 mg | 0 mg | from SR Legacy used | US food database (USDA SR Legacy) #170393 | C |
| Vitamin B-12, added | 0 µg | 0 µg | 0 µg | from SR Legacy used | US food database (USDA SR Legacy) #170393 | C |
| Fatty acids, total trans | 0 g | 0 g | 0 g | from SR Legacy used | US food database (USDA SR Legacy) #170393 | C |
| SFA 4:0 | 0 g | 0 g | 0 g | from SR Legacy used | US food database (USDA SR Legacy) #170393 | C |
| SFA 6:0 | 0 g | 0 g | 0 g | from SR Legacy used | US food database (USDA SR Legacy) #170393 | C |
| SFA 8:0 | 0 g | 0 g | 0 g | from SR Legacy used | US food database (USDA SR Legacy) #170393 | C |
| SFA 10:0 | 0 g | 0 g | 0 g | from SR Legacy used | US food database (USDA SR Legacy) #170393 | C |
| SFA 12:0 | 0 g | 0 g | 0 g | from SR Legacy used | US food database (USDA SR Legacy) #170393 | C |
| SFA 14:0 | 0 g | 0 g | 0 g | from SR Legacy used | US food database (USDA SR Legacy) #170393 | C |
| SFA 16:0 | 0.03 g | 0.03 g | 0.07 g | from SR Legacy used | US food database (USDA SR Legacy) #170393 | C |
| SFA 18:0 | 0.002 g | 0 g | 0 g | from SR Legacy used | US food database (USDA SR Legacy) #170393 | C |
| SFA 20:0 | 0 g | 0 g | 0 g | from SR Legacy used | US food database (USDA SR Legacy) #170393 | C |
| MUFA 18:1 | 0.011 g | 0.01 g | 0.02 g | from SR Legacy used | US food database (USDA SR Legacy) #170393 | C |
| PUFA 18:2 | 0.1 g | 0.09 g | 0.22 g | from SR Legacy used | US food database (USDA SR Legacy) #170393 | C |
| PUFA 18:3 | 0.002 g | 0 g | 0 g | from SR Legacy used | US food database (USDA SR Legacy) #170393 | C |
| PUFA 20:4 | 0 g | 0 g | 0 g | from SR Legacy used | US food database (USDA SR Legacy) #170393 | C |
| PUFA 22:6 n-3 (DHA) | 0 g | 0 g | 0 g | from SR Legacy used | US food database (USDA SR Legacy) #170393 | C |
| SFA 22:0 | 0 g | 0 g | 0 g | from SR Legacy used | US food database (USDA SR Legacy) #170393 | C |
| MUFA 14:1 | 0 g | 0 g | 0 g | from SR Legacy used | US food database (USDA SR Legacy) #170393 | C |
| MUFA 16:1 | 0.002 g | 0 g | 0 g | from SR Legacy used | US food database (USDA SR Legacy) #170393 | C |
| PUFA 18:4 | 0 g | 0 g | 0 g | from SR Legacy used | US food database (USDA SR Legacy) #170393 | C |
| MUFA 20:1 | 0 g | 0 g | 0 g | from SR Legacy used | US food database (USDA SR Legacy) #170393 | C |
| PUFA 20:5 n-3 (EPA) | 0 g | 0 g | 0 g | from SR Legacy used | US food database (USDA SR Legacy) #170393 | C |
| MUFA 22:1 | 0 g | 0 g | 0 g | from SR Legacy used | US food database (USDA SR Legacy) #170393 | C |
| PUFA 22:5 n-3 (DPA) | 0 g | 0 g | 0 g | from SR Legacy used | US food database (USDA SR Legacy) #170393 | C |
| Fatty acids, total monounsaturated | 0.012 g | 0.01 g | 0.03 g | from SR Legacy used | US food database (USDA SR Legacy) #170393 | C |
| Fatty acids, total polyunsaturated | 0.102 g | 0.09 g | 0.23 g | from SR Legacy used | US food database (USDA SR Legacy) #170393 | C |
| SFA 15:0 | 0 g | 0 g | 0 g | from SR Legacy used | US food database (USDA SR Legacy) #170393 | C |
| SFA 17:0 | 0 g | 0 g | 0 g | from SR Legacy used | US food database (USDA SR Legacy) #170393 | C |
| SFA 24:0 | 0 g | 0 g | 0 g | from SR Legacy used | US food database (USDA SR Legacy) #170393 | C |
| PUFA 20:2 n-6 c,c | 0 g | 0 g | 0 g | from SR Legacy used | US food database (USDA SR Legacy) #170393 | C |
| MUFA 17:1 | 0 g | 0 g | 0 g | from SR Legacy used | US food database (USDA SR Legacy) #170393 | C |
| PUFA 20:3 | 0 g | 0 g | 0 g | from SR Legacy used | US food database (USDA SR Legacy) #170393 | C |
| MUFA 15:1 | 0 g | 0 g | 0 g | from SR Legacy used | US food database (USDA SR Legacy) #170393 | C |
| Lactose | 0 g | 0 g | 0 g | from SR Legacy used | US food database (USDA SR Legacy) #170393 | C |
| 0 g | 0 g | 0 g | second database · not used | UK food tables (CoFID 2021) #13-496 | C | |
| Lutein + zeaxanthin | 256 µg | 217.6 µg | 569.16 µg | from SR Legacy used | US food database (USDA SR Legacy) #170393 | C |
| Manganese | 0.13 mg | 0.11 mg | 0.29 mg | listed used | US food database (USDA Foundation Foods) #2258586 | C |
| 0.07 mg | 0.06 mg | 0.16 mg | second database · not used | UK food tables (CoFID 2021) #13-496 | C | |
| Niacin (B3, preformed) | 1.406 mg | 1.2 mg | 3.13 mg | listed used | US food database (USDA Foundation Foods) #2258586 | C |
| 0.2 mg | 0.17 mg | 0.44 mg | second database · not used · 7× | UK food tables (CoFID 2021) #13-496 | C | |
| Pantothenic acid (B5) | 0.273 mg | 0.23 mg | 0.61 mg | from SR Legacy used | US food database (USDA SR Legacy) #170393 | C |
| 0.27 mg | 0.23 mg | 0.6 mg | second database · not used | UK food tables (CoFID 2021) #13-496 | C | |
| Retinol | 0 µg | 0 µg | 0 µg | from SR Legacy used | US food database (USDA SR Legacy) #170393 | C |
| 0 µg | 0 µg | 0 µg | second database · not used | UK food tables (CoFID 2021) #13-496 | C |
Change the amount to rescale the first column. Nutrients a database doesn't list are missing, not zero.
Absorption studies
Studies of how much of a nutrient gets in; those done in animals are marked. This page quotes a figure only from a study that passes our screen: adults, graded A, of this food in this preparation, with a test dose on record and a source that has passed our evidence check. The exception is calcium on our calcium card: its figure comes from the card’s own study, checked with the card, and is marked “used” even where that study misses a step of this screen. The others are listed so nothing is hidden, each with the first check it fails.
| Study | Nutrient | Absorbed | Test dose | People | Grade | On this page |
|---|---|---|---|---|---|---|
| Morris et al. 2008: control carrot standard · harvested, sliced, stored at −20 °C; cooking not stated full text read | Calcium | 52.1 % | 38 mg | 30 | A | Used |
| Study | Nutrient | Absorbed | Test dose | People | Grade | On this page |
|---|---|---|---|---|---|---|
| Bills 1990: carrot not stated · canned carrots, microwaved 1 min · 0.5 mg pyridoxine-equivalent = 836 g canned carrots at 0.060 mg B6/100 g full text read | Vitamin B6 | – | not reported | 7 | B | Not used: it measures something other than the share absorbed. |
| Gillooly et al. 1983: carrot not stated · boiled 20 min in salted water (750 g vegetable in 1500 ml water with 5 g NaCl; lentils 40 min in 2500 ml), homogenised in a Waring blender to a thick soup; 100 g eaten (equivalent to 50 g uncooked vegetable); peeled before cooking · 3 mg Fe as FeSO4.7H2O (59Fe or 55Fe) mixed into 100 g puree; native iron of the vegetable not reported full text read | Iron | 9.8 % | not reported | 9 | A | Not used: no test dose on record. |
| Hodgkinson et al. 2025: carrots (pig) animal study jumbo carrots · Simmered with water, diced 1-2 cm · diet protein level not read; ration 0.08 x metabolic body weight (kg^0.75) per day full text read | Protein | 100 % | not reported | 6 | B | Not used: we haven’t confirmed how the food was prepared in this study. |
| Tang et al. 2005: carrot not stated · puréed; cooking not stated · 100 g carrot = 19.2 umol trans-beta-carotene equivalents (about 10.3 mg) abstract only | Vitamin A | – | not reported | 7 | A | Not used: it measures something other than the share absorbed. |
| Huang et al. 2000: carrot not stated · stir-fried shredded carrot · single ingestion; load not stated abstract only | Beta-carotene | – | not reported | 10 | A | Not used: it measures something other than the share absorbed. |
| Livny et al. 2003: carrot, cooked and puréed not stated · cooked, puréed · 15 mg beta-carotene abstract only | Beta-carotene | 65.1 % | not reported | 8 | A | Not used: we haven’t confirmed how the food was prepared in this study. |
| Livny et al. 2003: carrot, raw and chopped not stated · raw, chopped · 15 mg beta-carotene abstract only | Beta-carotene | 41.4 % | not reported | 8 | A | Not used: we haven’t confirmed how the food was prepared in this study. |
| Ghavami et al. 2012: carrot not stated · raw; and stir-fried · 100 g portions abstract only | Beta-carotene | – | not reported | – | A | Not used: it measures something other than the share absorbed. |
Hazard rows as the dataset rates them
- Cadmium · Nothing to watch: under the limit · A daily serving adds 9% to an average adult's cadmium intake (EFSA 2012 adult median, 1.77 µg/kg body weight/week; Canadian adults in 2007: 1.2-1.75), far from doubling it, so no cap. · Health Canada Total Diet Study, trace elements · A
- Lead · Nothing to watch: doesn’t double average intake · adds 2.1% · Health Canada Total Diet Study, trace elements · A
- Nitrate · Context · Context only: 10% · EFSA 2008 · A
Oxalate, phytate and gut-tolerance measurements
- fodmap excess fructose: none (fructose 0.55 < glucose 0.59) g/100 g · fresh weight · raw · grade B · US food database (USDA SR Legacy)
- fodmap fructan: 0.11 g/100 g · fresh weight · raw · grade A · Ferjancic 2024
- fodmap fructan: contested (#33) g/100 g dry matter · dry matter (dry matter 13.3 g/100 g fresh carrot; about 0.27 g/100 g fresh weight by our arithmetic) · raw · grade A · Kalala 2017
- fodmap fructan: contested (#33) g/100 g dry matter · dry matter (dry matter 11.9 g/100 g fresh) · steamed (model cooking) · grade B · Kalala 2017
- fodmap mannitol: 0.2 g/100 g · as listed (basis not stated) · raw · grade C · Canadian Nutrient File 2026
- histamine: not detected (n = 13) mg/kg · as sold · raw · grade A · Sanchezperez 2018
- histamine: mean 0.031 · standard deviation 0.006 · n 3 mg/kg · as cooked (fried carrot) · carrot fried (150 C, 1-5 min, soybean oil) · grade B · Chung 2017
- oxalate soluble: 23 mg/100 g · not stated · raw · grade A · Akhtar 2011
- oxalate total: 16–49 mg/100 g · not stated · raw · grade A · Akhtar 2011
- tyramine: not detected (n 13) mg/kg · fresh weight · carrot, as sold (raw vs cooked not stated) · grade B · Sanchezperez 2018
Sources
- Akhtar MS, Israr B, Bhatty N, Ali A (2011) Effect of cooking on soluble and insoluble oxalate contents in selected Pakistani vegetables and beans. Int J Food Prop 14(1):241-249 · doi:10.1080/10942910903326056
akhtar2011· abstract only · Publisher copyright (journal article) - Chung BY, Park SY, Byun YS, Son JH, Choi YW, Cho YS, Kim HO, Park CW. Effect of different cooking methods on histamine levels in selected foods. Ann Dermatol 2017;29(6):706-714. · doi:10.5021/ad.2017.29.6.706 · PMID 29200758
chung2017· full text read · CC BY-NC 4.0 - Health Canada, Canadian Nutrient File 2026 (14th edition)
cnf-2026· dataset · Open Government Licence – Canada 2.0 - Public Health England, Composition of Foods Integrated Dataset (CoFID) 2021
cofid-2021· dataset · Open Government Licence v3.0 - Gillooly M, Bothwell TH, Torrance JD, MacPhail AP, Derman DP, Bezwoda WR, et al. (1983). The effects of organic acids, phytates and polyphenols on the absorption of iron from vegetables. Br J Nutr 49:331-42 · doi:10.1079/bjn19830042 · PMID 6860621
doi:10.1079/bjn19830042· full text read · licence not recorded - EFSA CONTAM Panel (2008) Nitrate in vegetables. EFSA Journal 689 · doi:10.2903/j.efsa.2008.689
efsa-2008-nitrate· full text read · EFSA Journal: CC BY-ND 4.0 - USDA FoodData Central, Foundation Foods, release 2026-04-30
fdc-foundation-2026-04-30· dataset · CC0 1.0 (public domain) - USDA FoodData Central, SR Legacy, 2018-04
fdc-sr-legacy-2018-04· dataset · CC0 1.0 (public domain) - Ferjancic B et al. 2024, Fructan content in most commonly consumed Slovenian foods, Front Nutr (PMC11327153)
ferjancic2024· full text read · CC BY 4.0 - Health Canada, Canadian Total Diet Study – Trace Elements (2005–2018 composites)
hc-tds-trace-elements· dataset · Open Government Licence – Canada 2.0 - Kalala G, Kambashi B, Everaert N, et al. Characterization of fructans and dietary fibre profiles in raw and steamed vegetables. Int J Food Sci Nutr (online 2017). · doi:10.1080/09637486.2017.1412404 · PMID 29252035
kalala2017· full text read · author copy hosted by UCLouvain (FOOD4GUT) - Bills ND (1990). In vivo and in vitro determination of the bioavailability of vitamin B-6 from plant foods containing pyridoxine glucoside. PhD thesis, Oregon State University (advisor JE Leklem).
osu:bills1990· full text read · ScholarsArchive@OSU (open PDF; rights not evaluated) - Huang C, Tang YL, Chen CY, Chen ML, Chu CH, Hseu CT. The bioavailability of beta-carotene in stir- or deep-fried vegetables in men determined by measuring the serum response to a single ingestion. J Nutr 2000;130:534-40. · doi:10.1093/jn/130.3.534 · PMID 10702581
pmid:10702581· abstract only · publisher; abstract quoted - Livny O, Reifen R, Levy I, Madar Z, Faulks R, Southon S, Schwartz B. Beta-carotene bioavailability from differently processed carrot meals in human ileostomy volunteers. Eur J Nutr 2003;42:338-45. · doi:10.1007/s00394-003-0430-6 · PMID 14673607
pmid:14673607· abstract only · publisher; abstract quoted - Tang G, Qin J, Dolnikowski GG, Russell RM, Grusak MA. Spinach or carrots can supply significant amounts of vitamin A as assessed by feeding with intrinsically deuterated vegetables. Am J Clin Nutr 2005;82:821-8. · doi:10.1093/ajcn/82.4.821 · PMID 16210712
pmid:16210712· abstract only · publisher; abstract quoted - Morris J, Hawthorne KM, Hotze T, Abrams SA, Hirschi KD. Nutritional impact of elevated calcium transport activity in carrots. PNAS 2008;105:1431–5 · doi:10.1073/pnas.0709005105 · PMID 18202180
pmid:18202180· full text read · Publisher copyright (journal article) - Ghavami A, Coward WA, Bluck LJ. The effect of food preparation on the bioavailability of carotenoids from carrots using intrinsic labelling. Br J Nutr 2012;107:1350-1366 · doi:10.1017/s000711451100451x · PMID 21923982
pmid:21923982· abstract only · licence not recorded - Hodgkinson SM, Stroebinger N, Stein HH, Fanelli NS, de Vries S, van der Wielen N, et al. True ileal amino acid digestibility of human foods classified according to food type as determined in the growing pig. J Nutr 2025;155:3384-3400. · doi:10.1016/j.tjnut.2025.08.004 · PMID 40812478
pq_hodgkinson2025· full text read · CC BY (Europe PMC licence field) - Sánchez-Pérez S et al. 2018, Foods 7:205, Table 1 (histamine in plant foods; PMC6306728)
sanchezperez2018· full text read · CC BY 4.0
Body map 2026-10-25.1: each nutrient’s job comes from an agency fact sheet, linked beside it under Good for.
The plain words: “a lot” means one serving (100 g when the food has no serving size) gives at least 20% of the daily amount (the reference intake), “some” at least 10%, “a little” at least 2% (the cut-offs are ours, one set for every page: 20% and 10% are borrowed from the US labelling terms “high” and “good source” and applied to Health Canada’s daily amount, whereas Health Canada’s own shopper rule says 15%; provisional: they may change in a later method version). The daily amount is Health Canada’s Dietary Reference Intake for adults 19–30; where men and women need different amounts we use the higher one (protein: 56 g for men, 46 g for women). The percentage printed under each nutrient is the printed amount as a share of that daily amount, rounded to the nearest whole number, and the word is read from that percentage, so the amount, the percentage and the word always agree. Calcium with a measured absorption is scaled by how well it gets in compared with milk.
The scale: “Nothing to watch” means a serving a day stays under the limit at ordinary amounts; “Go easy” means a serving a day can push past the limit for adults who already take in the most, or fewer than 2 servings reach it; “Limit it” means once a week or less. The dataset’s own rating is under “How we got this”. Provisional: the scale may change in a later method version.
Measured absorption under Good for: grade-A studies in adults that tested this preparation of this food, as a share of the listed amount (the share digested, for protein), quoted once each source has passed our evidence check; animal studies and other variants stay in the table above. Provisional: this screen may change in a later method version.