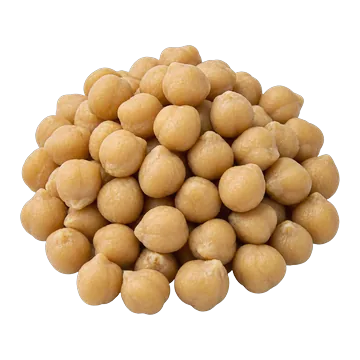
Chickpeas, cooked
Checked by us One serving: 87 g (about ½ cup) · 143 kcal
Lots of folate.
Nothing to watch.
Good for
How we counted this
What one serving (87 g) gives you.
Your body needs enough of each of these. Past enough, more doesn’t help. Amounts are what the food databases list, not what your body absorbs, unless a row says it was measured.
The words: “A lot” means one serving gives 20% or more of Health Canada’s daily amount, “Some” 10% to 19%, “A little” 2% to 9%, “Almost none” under 2%. Strongest word first; within a word, protein and fibre lead, then the biggest share. ?
A milligram (mg) is a thousandth of a gram, and a microgram (µg) a thousandth of a milligram: 1,000 µg make 1 mg.
- A lot
Folate
Your body needs it to make DNA and to divide new cells.
Learn more
150 µg in one serving: 38% of the 400 µg a day.
Source: How much of it gets in hasn’t been measured for this food yet. NIH Office of Dietary Supplements, folate fact sheet for health professionals
21 more nutrients below “a lot”
- Some
Protein
Your muscles, and every other tissue, are built and repaired from it.
Learn more
7.71 g in one serving: 14% of the 56 g a day men need, 17% of the 46 g women need. The word follows the smaller share, which is the share of the higher amount. ?
Listed amount only. 4 absorption studies of this nutrient are on file for this food, but none is quoted yet. Each one is in The numbers, with the reason. See the studies
- Some
Fibre
Keeps your gut moving.
Learn more
6.61 g in one serving: 17% of the 38 g a day men need, 26% of the 25 g women need. The word follows the smaller share, which is the share of the higher amount. ?
Source: How much of it gets in hasn’t been measured for this food yet. Institute of Medicine 2005, Dietary Reference Intakes for Energy, Carbohydrate, Fiber, Fat, Fatty Acids, Cholesterol, Protein, and Amino Acids
- Some
Iron
Carries oxygen in your blood.
Learn more
2.51 mg in one serving: 31% of the 8 mg a day men need, 14% of the 18 mg women need. The word follows the smaller share, which is the share of the higher amount. ?
Listed amount only. 1 absorption study of this nutrient is on file for this food, but none is quoted yet. Each one is in The numbers, with the reason. See the studies
Source: NIH Office of Dietary Supplements, iron fact sheet for health professionals
- Some
Zinc
Your immune system and healing wounds depend on it.
Learn more
1.33 mg in one serving: 12% of the 11 mg a day men need, 17% of the 8 mg women need. The word follows the smaller share, which is the share of the higher amount. ?
Source: How much of it gets in hasn’t been measured for this food yet. NIH Office of Dietary Supplements, zinc fact sheet for health professionals
- Some
Niacin (B3, niacin equivalents)
More than 400 of your enzymes need it to work.
Learn more
1.69 mg in one serving: 11% of the 16 mg a day men need, 12% of the 14 mg women need. The word follows the smaller share, which is the share of the higher amount. ?
Source: How much of it gets in hasn’t been measured for this food yet. NIH Office of Dietary Supplements, niacin fact sheet for health professionals
- Some
Magnesium
Your muscles and nerves need it to work.
Learn more
41.8 mg in one serving: 10% of the 400 mg a day men need, 13% of the 310 mg women need. The word follows the smaller share, which is the share of the higher amount. ?
Source: How much of it gets in hasn’t been measured for this food yet. NIH Office of Dietary Supplements, magnesium fact sheet for health professionals
- A little
Vitamin B6
Helps you use protein, and your brain needs it to make its chemical messengers.
Learn more
0.12 mg in one serving: 9% of the 1.3 mg a day.
Source: How much of it gets in hasn’t been measured for this food yet. NIH Office of Dietary Supplements, vitamin B6 fact sheet for health professionals
- A little
Thiamin (B1)
Your cells use it to get energy from food, and so to grow and work.
Learn more
0.1 mg in one serving: 8% of the 1.2 mg a day men need, 9% of the 1.1 mg women need. The word follows the smaller share, which is the share of the higher amount. ?
Source: How much of it gets in hasn’t been measured for this food yet. NIH Office of Dietary Supplements, thiamin fact sheet for health professionals
- A little
Potassium
Your nerves, muscles and kidneys need it to work.
Learn more
253 mg in one serving: 7% of the 3,400 mg a day men need, 10% of the 2,600 mg women need. The word follows the smaller share, which is the share of the higher amount. ?
Source: How much of it gets in hasn’t been measured for this food yet. NIH Office of Dietary Supplements, potassium fact sheet for health professionals
- A little
Choline
Your cells need it for their membranes, and to make acetylcholine, a messenger for memory, mood and muscle control.
Learn more
37.2 mg in one serving: 7% of the 550 mg a day men need, 9% of the 425 mg women need. The word follows the smaller share, which is the share of the higher amount. ?
Source: How much of it gets in hasn’t been measured for this food yet. NIH Office of Dietary Supplements, choline fact sheet for health professionals
- A little
Selenium
Your thyroid uses it to make its hormones.
Learn more
3.22 µg in one serving: 6% of the 55 µg a day.
Source: How much of it gets in hasn’t been measured for this food yet. NIH Office of Dietary Supplements, selenium fact sheet for health professionals
- A little
Calcium
Builds your bones and teeth.
Learn more
42.6 mg in one serving: 4% of the 1,000 mg a day.
Source: How much of it gets in hasn’t been measured for this food yet. NIH Office of Dietary Supplements, calcium fact sheet for health professionals
- A little
Riboflavin (B2)
Your cells use it to make energy and handle fats. It also helps turn tryptophan into niacin and activate vitamin B6.
Learn more
0.05 mg in one serving: 4% of the 1.3 mg a day men need, 5% of the 1.1 mg women need. The word follows the smaller share, which is the share of the higher amount. ?
Source: How much of it gets in hasn’t been measured for this food yet. NIH Office of Dietary Supplements, riboflavin fact sheet for health professionals
- A little
Vitamin K1
Your blood needs it to clot.
Learn more
3.48 µg in one serving: 3% of the 120 µg a day men need, 4% of the 90 µg women need. The word follows the smaller share, which is the share of the higher amount. ?
Source: How much of it gets in hasn’t been measured for this food yet. NIH Office of Dietary Supplements, vitamin K fact sheet for health professionals
- A little
Omega-3: ALA
The one omega-3 your body can’t make: it must come from food. Your cells build it into their membranes and burn it for energy.
Learn more
37.4 mg in one serving: 2% of the 1,600 mg a day men need, 3% of the 1,100 mg women need. The word follows the smaller share, which is the share of the higher amount. ?
Source: How much of it gets in hasn’t been measured for this food yet. NIH Office of Dietary Supplements, omega-3 fatty acids fact sheet for health professionals
- A little
Vitamin E
Shields the fats in your cells from damage; your immune system uses it too.
Learn more
0.3 mg in one serving: 2% of the 15 mg a day.
Source: How much of it gets in hasn’t been measured for this food yet. NIH Office of Dietary Supplements, vitamin E fact sheet for health professionals
- Almost none
Vitamin C
Your body makes collagen with it, which wounds need to heal. It also helps you absorb iron from plants.
Learn more
1.13 mg in one serving: 1% of the 90 mg a day men need, 2% of the 75 mg women need. The word follows the smaller share, which is the share of the higher amount. ?
Source: How much of it gets in hasn’t been measured for this food yet. NIH Office of Dietary Supplements, vitamin C fact sheet for health professionals
- Almost none
Vitamin A
Your eyes need it to see in dim light.
Learn more
Getting enough matters; more than enough doesn’t sharpen your sight.
0.87 µg in one serving: under 1% of the 900 µg a day men need, under 1% of the 700 µg women need. The word follows the smaller share, which is the share of the higher amount. ?
Source: How much of it gets in hasn’t been measured for this food yet. NIH Office of Dietary Supplements, vitamin A fact sheet for health professionals
- Almost none
Omega-3: EPA + DHA
Long-chain omega-3s, built into your cell membranes. DHA is concentrated in your brain and retinas.
Learn more
0 mg in one serving: under 1% of the 250 mg a day.
Health Canada sets no daily amount for these fats, so the daily figure here is the European Food Safety Authority’s.
Source: How much of it gets in hasn’t been measured for this food yet. NIH Office of Dietary Supplements, omega-3 fatty acids fact sheet for health professionals
- Almost none
Vitamin B12
Your body needs it to make red blood cells and keep nerves working.
Learn more
0 µg in one serving: under 1% of the 2.4 µg a day.
Source: How much of it gets in hasn’t been measured for this food yet. NIH Office of Dietary Supplements, vitamin B12 fact sheet for health professionals
- Almost none
Vitamin D
Your body needs it to absorb calcium and keep your bones hard.
Learn more
Your skin also makes it in sunlight, so food is only one of its sources.
0 µg in one serving: under 1% of the 15 µg a day.
Source: How much of it gets in hasn’t been measured for this food yet. NIH Office of Dietary Supplements, vitamin D fact sheet for health professionals
Watch out
How we counted this
Checked for cadmium and lead: fine at normal amounts.
Cadmium
Nothing to watchYou’d need about 64 servings a day, every day, of this food alone to use up what an average adult’s intake leaves under the limit.
Learn more
One serving carries 0.11 µg
How we got this
A serving a day adds 0.6% to what an average adult already takes in: a share of that intake, not of the limit. With that serving every day, an average adult would be at about 71% of the limit.
An average adult already takes in about 71% of the limit. One serving a day fits in the room left.
Counted from zero, with no allowance for what adults already take in from other food, 130,000 g a week would reach the limit.
Why this rating: Eating it daily comes to 609 g a week, which stays within the 39,000 g of room left before the limit.
The dataset’s rating: Nothing to watch: under the limit
A daily serving adds 0.64% to an average adult's cadmium intake (EFSA 2012 adult median, 1.77 µg/kg body weight/week; Canadian adults in 2007: 1.2-1.75), far from doubling it, so no cap.
US FDA, Total Diet Study FY2018–FY2020 Elements Report Supplement · grade B
Lead
Nothing to watchYou’d need more than 100 servings a day, every day, of this food alone to double the lead an average adult already gets. No dose is known to be safe, so doubling is where we flag.
Learn more
A serving a day adds 1% to what an average adult already takes in. There is no limit to take a share of.
One serving carries 0.35 µg (upper bound)
How we got this
The dataset’s rating: Nothing to watch: doesn’t double average intake
lower bound 0, upper bound 4 µg/kg; at most +0.9-1.0% to the EFSA average of 35 µg/day
US FDA, Total Diet Study FY2018–FY2020 Elements Report Supplement · grade B
Worth knowing
No limit applies, so none is rated.
Sugar
4.2 g of sugar in a 87 g serving, natural and added together.
Learn more
Shown, not rated. The food tables we read give total sugar, and few give added sugar, so the site can’t yet tell sugar added in making a food from the sugar in fruit or milk.
Also measured in it
Figures from the dataset. None has a limit to be rated against, so none is a verdict.
Oxalate: 92–214 mg per 100 g in the sources we hold. · PubMed 29580532 · grade B
We haven’t rated this food for oxalate. We count only a figure that comes from a grade A or B source and says it was measured per 100 g of the food as eaten, and none of the figures here does both.
Phytate: 694 mg per 100 g as eaten. · PubMed 30400385 · grade A
Phytate (also written InsP6, IP6 or phytic acid), the form in which plants store phosphorus, is found in whole grains, beans and nuts. It binds zinc in the gut and lowers how much zinc and plant (non-heme) iron you absorb. No limit applies.
Source: NIH Office of Dietary Supplements, Zinc fact sheet · NIH Office of Dietary Supplements, Iron fact sheet
Also checked (nothing to act on) · 2
Noted for context, or not measured in this food yet.
Chickpea is not on Health Canada's priority allergen list; no agency source naming chickpea or legume cross-reactivity was found
Context, not a rating. Health Canada's lectin cooking advice is written for dry red kidney beans, and its statement that canning heat destroys the lectins is about canned red kidney beans ("in canned red kidney beans, which do not require further cooking"), not canned legumes in general. Chickpeas are not named: Foodtopsy raises no lectin flag for boiled or canned chickpeas, but the agency page does not itself clear them.
Better options
How we counted this
“Better” here always means better at something the row names: more of one nutrient, more nutrients per serving, or the goal you pick. It never means better in every way.
Every amount below is for the same weight, 87 g, the size of one serving of this food, so a swap compares like with like. A serving of another food can be bigger or smaller.
A food is listed only if it gives clearly more: at least a fifth more than this food, and at least 10% of the daily amount more.
More of what it’s good for
For folate: Chicken liver, simmered would lead, in the same 87 g, but is left out (Preformed vitamin A (retinol): limit it).
More nutrients per serving, counted together
The other main-dish proteins we’ve checked with more nutrients per serving than this one, counting at most 100 kcal. One score ranks them all, so the same few often lead.
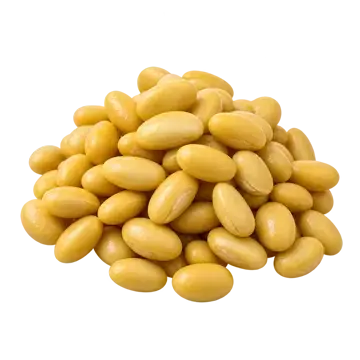 Soybeans, cooked
- More omega-3: ALA (520 mg vs 37.4 mg)
- More riboflavin (0.25 mg vs 0.05 mg)
- More protein (15.8 g vs 7.71 g)
- Less folate (47 µg vs 150 µg)
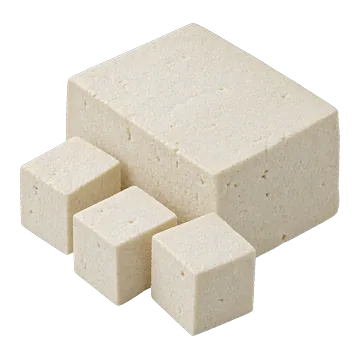 Tofu, calcium-set
- More calcium (305 mg vs 42.6 mg)
- More omega-3: ALA (278 mg vs 37.4 mg)
- More iron (4.66 mg vs 2.51 mg)
- Less folate (13.1 µg vs 150 µg)
- Less fibre (0.26 g vs 6.61 g)
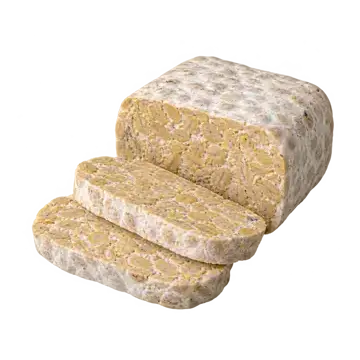 Tempeh
- More niacin (5.11 mg vs 1.69 mg)
- More riboflavin (0.31 mg vs 0.05 mg)
- More protein (17.7 g vs 7.71 g)
- Less folate (20.9 µg vs 150 µg)
Where the calcium card measured that less calcium gets in than from milk, calcium counts for less; everything else is as listed.
Your goal
Your goal changes only this list, not what the food gives you or what to watch.
Losing weight: fewer calories, and more nutrients, protein and fibre for each calorie.
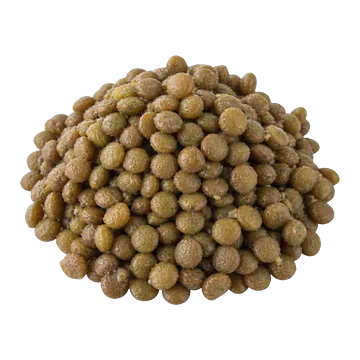 Lentils, cooked101 kcal in 87 g (this food: 143)
- Soybeans, cooked
- More omega-3: ALA (520 mg vs 37.4 mg)
- More riboflavin (0.25 mg vs 0.05 mg)
- More protein (15.8 g vs 7.71 g)
- Less folate (47 µg vs 150 µg)
- Tofu, calcium-set
- 66 kcal in 87 g (this food: 143)
- More calcium (305 mg vs 42.6 mg)
- More omega-3: ALA (278 mg vs 37.4 mg)
- More iron (4.66 mg vs 2.51 mg)
- Less folate (13.1 µg vs 150 µg)
- Less fibre (0.26 g vs 6.61 g)
Building muscle: more protein and more calories, per 100 g.
- Tempeh20.3 g protein · 192 kcal per 100 g
- Soybeans, cooked18.2 g protein · 172 kcal per 100 g
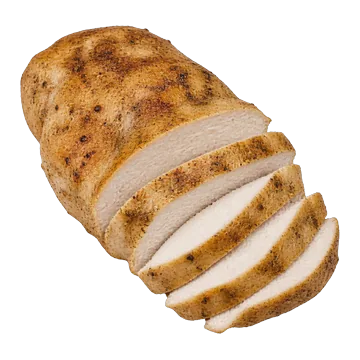 Chicken breast, roasted31 g protein · 165 kcal per 100 g
Why some foods aren’t suggested
Left out: Chicken liver, simmered (Preformed vitamin A (retinol): limit it).
Bring a tracker export or describe your usual week. The same rules check all of it.
The numbers
Open every value
Name in the database: Chickpeas (garbanzo beans), cooked
How the serving was set: 125 mL (1/2 cup), cooked (Health Canada K.2: 125 mL cooked, frozen or canned); grams = CNF conversion factor 0.86644 x 100 g for 125 ml (food 3390)
Listed nutrients, per 100 g
For each nutrient, the value this page uses is marked “used”. A row marked “second database” is another database’s figure for a matching food, kept so you can see how far databases disagree (they can differ in the samples analysed, lab methods and rounding). Its own cells are worked out from it, but none of the page’s words or scores are.
| Nutrient | Per serving | Per 100 calories | How | Source | Grade | |
|---|---|---|---|---|---|---|
| Omega-3: ALA | 0.043 g | 0.04 g | 0.03 g | listed used | US food database (USDA SR Legacy) #173757 | C |
| Calcium | 49 mg | 42.63 mg | 29.88 mg | listed used | US food database (USDA SR Legacy) #173757 | C |
| 48 mg | 41.76 mg | 29.27 mg | second database · not used | UK food tables (CoFID 2021) #13-662 | C | |
| 49 mg | 42.63 mg | 29.88 mg | copy of USDA · not used | Canadian Nutrient File 2026 #3390 | C | |
| Carbohydrate | 27.42 g | 23.86 g | 16.72 g | listed used | US food database (USDA SR Legacy) #173757 | C |
| Choline | 42.8 mg | 37.24 mg | 26.1 mg | listed used | US food database (USDA SR Legacy) #173757 | C |
| Energy | 164 kcal | 142.68 kcal | – | FDC Energy (kcal) used | US food database (USDA SR Legacy) | – |
| Omega-3: EPA + DHA | 0 g | 0 g | 0 g | listed used | US food database (USDA SR Legacy) #173757 | C |
| Fat | 2.59 g | 2.25 g | 1.58 g | listed used | US food database (USDA SR Legacy) #173757 | C |
| 3 g | 2.61 g | 1.83 g | second database · not used | UK food tables (CoFID 2021) #13-662 | C | |
| Cholesterol | 0 mg | 0 mg | 0 mg | listed used | US food database (USDA SR Legacy) #173757 | C |
| Fatty acids, total saturated | 0.269 g | 0.23 g | 0.16 g | listed used | US food database (USDA SR Legacy) #173757 | C |
| Fibre | 7.6 g | 6.61 g | 4.63 g | listed used | US food database (USDA SR Legacy) #173757 | C |
| 10.6 g | 9.22 g | 6.46 g | second database · not used | UK food tables (CoFID 2021) #13-662 | C | |
| Folate | 172 µg | 149.64 µg | 104.88 µg | listed used | US food database (USDA SR Legacy) #173757 | C |
| 35 µg | 30.45 µg | 21.34 µg | second database · not used · 4.9× | UK food tables (CoFID 2021) #13-662 | C | |
| Iron | 2.89 mg | 2.51 mg | 1.76 mg | listed used | US food database (USDA SR Legacy) #173757 | C |
| 1.9 mg | 1.65 mg | 1.16 mg | second database · not used | UK food tables (CoFID 2021) #13-662 | C | |
| Magnesium | 48 mg | 41.76 mg | 29.27 mg | listed used | US food database (USDA SR Legacy) #173757 | C |
| 44 mg | 38.28 mg | 26.83 mg | second database · not used | UK food tables (CoFID 2021) #13-662 | C | |
| Niacin (B3, niacin equivalents) | 1.943 mg | 1.69 mg | 1.18 mg | listed used | Canadian Nutrient File 2026 #3390 | C |
| Phosphorus | 168 mg | 146.16 mg | 102.44 mg | listed used | US food database (USDA SR Legacy) #173757 | C |
| 141 mg | 122.67 mg | 85.98 mg | second database · not used | UK food tables (CoFID 2021) #13-662 | C | |
| Potassium | 291 mg | 253.17 mg | 177.44 mg | listed used | US food database (USDA SR Legacy) #173757 | C |
| 281 mg | 244.47 mg | 171.34 mg | second database · not used | UK food tables (CoFID 2021) #13-662 | C | |
| Protein | 8.86 g | 7.71 g | 5.4 g | listed used | US food database (USDA SR Legacy) #173757 | C |
| 8.4 g | 7.31 g | 5.12 g | second database · not used | UK food tables (CoFID 2021) #13-662 | C | |
| Riboflavin (B2) | 0.063 mg | 0.05 mg | 0.04 mg | listed used | US food database (USDA SR Legacy) #173757 | C |
| 0.03 mg | 0.03 mg | 0.02 mg | second database · not used · 2.1× | UK food tables (CoFID 2021) #13-662 | C | |
| Selenium | 3.7 µg | 3.22 µg | 2.26 µg | listed used | US food database (USDA SR Legacy) #173757 | C |
| 29.9 µg | 26.01 µg | 18.23 µg | second database · not used · 8.1× | UK food tables (CoFID 2021) #13-662 | C | |
| Sodium | 7 mg | 6.09 mg | 4.27 mg | listed used | US food database (USDA SR Legacy) #173757 | C |
| 1 mg | 0.87 mg | 0.61 mg | second database · not used · 7× | UK food tables (CoFID 2021) #13-662 | C | |
| Sugars | 4.8 g | 4.18 g | 2.93 g | listed used | US food database (USDA SR Legacy) #173757 | C |
| 0.7 g | 0.61 g | 0.43 g | second database · not used · 6.9× | UK food tables (CoFID 2021) #13-662 | C | |
| Thiamin (B1) | 0.116 mg | 0.1 mg | 0.07 mg | listed used | US food database (USDA SR Legacy) #173757 | C |
| 0.14 mg | 0.12 mg | 0.09 mg | second database · not used | UK food tables (CoFID 2021) #13-662 | C | |
| Vitamin A | 1 µg | 0.87 µg | 0.61 µg | listed used | US food database (USDA SR Legacy) #173757 | C |
| Vitamin B12 | 0 µg | 0 µg | 0 µg | listed used | US food database (USDA SR Legacy) #173757 | C |
| 0 µg | 0 µg | 0 µg | second database · not used | UK food tables (CoFID 2021) #13-662 | C | |
| Vitamin B6 | 0.139 mg | 0.12 mg | 0.08 mg | listed used | US food database (USDA SR Legacy) #173757 | C |
| 0.38 mg | 0.33 mg | 0.23 mg | second database · not used · 2.7× | UK food tables (CoFID 2021) #13-662 | C | |
| Vitamin C | 1.3 mg | 1.13 mg | 0.79 mg | listed used | US food database (USDA SR Legacy) #173757 | C |
| Vitamin D | 0 µg | 0 µg | 0 µg | listed used | US food database (USDA SR Legacy) #173757 | C |
| 0 µg | 0 µg | 0 µg | second database · not used | UK food tables (CoFID 2021) #13-662 | C | |
| Vitamin E | 0.35 mg | 0.3 mg | 0.21 mg | listed used | US food database (USDA SR Legacy) #173757 | C |
| 1.7 mg | 1.48 mg | 1.04 mg | second database · not used · 4.9× | UK food tables (CoFID 2021) #13-662 | C | |
| Vitamin K1 | 4 µg | 3.48 µg | 2.44 µg | listed used | US food database (USDA SR Legacy) #173757 | C |
| 2.24 µg | 1.95 µg | 1.37 µg | second database · not used | UK food tables (CoFID 2021) #13-662 | C | |
| Water | 60.21 g | 52.38 g | 36.71 g | listed used | US food database (USDA SR Legacy) #173757 | C |
| 62.3 g | 54.2 g | 37.99 g | second database · not used | UK food tables (CoFID 2021) #13-662 | C | |
| Zinc | 1.53 mg | 1.33 mg | 0.93 mg | listed used | US food database (USDA SR Legacy) #173757 | C |
| 1.13 mg | 0.98 mg | 0.69 mg | second database · not used | UK food tables (CoFID 2021) #13-662 | C |
| Nutrient | Per 100 g | Per serving | Per 100 calories | How | Source | Grade |
|---|---|---|---|---|---|---|
| Beta-carotene | 16 µg | 13.92 µg | 9.76 µg | listed used | US food database (USDA SR Legacy) #173757 | C |
| 23 µg | 20.01 µg | 14.02 µg | second database · not used | UK food tables (CoFID 2021) #13-662 | C | |
| Copper | 0.352 mg | 0.31 mg | 0.21 mg | listed used | US food database (USDA SR Legacy) #173757 | C |
| 0.26 mg | 0.23 mg | 0.16 mg | second database · not used | UK food tables (CoFID 2021) #13-662 | C | |
| Ash | 0.92 g | 0.8 g | 0.56 g | listed used | US food database (USDA SR Legacy) #173757 | C |
| Alcohol, ethyl | 0 g | 0 g | 0 g | listed used | US food database (USDA SR Legacy) #173757 | C |
| Caffeine | 0 mg | 0 mg | 0 mg | listed used | US food database (USDA SR Legacy) #173757 | C |
| Theobromine | 0 mg | 0 mg | 0 mg | listed used | US food database (USDA SR Legacy) #173757 | C |
| Energy | 686 kj | 596.82 kj | 418.29 kj | listed used | US food database (USDA SR Legacy) #173757 | C |
| Vitamin A, IU | 27 iu | 23.49 iu | 16.46 iu | listed used | US food database (USDA SR Legacy) #173757 | C |
| Carotene, alpha | 0 µg | 0 µg | 0 µg | listed used | US food database (USDA SR Legacy) #173757 | C |
| Vitamin D (D2 + D3), International Units | 0 iu | 0 iu | 0 iu | listed used | US food database (USDA SR Legacy) #173757 | C |
| Cryptoxanthin, beta | 0 µg | 0 µg | 0 µg | listed used | US food database (USDA SR Legacy) #173757 | C |
| Lycopene | 0 µg | 0 µg | 0 µg | listed used | US food database (USDA SR Legacy) #173757 | C |
| Folic acid | 0 µg | 0 µg | 0 µg | listed used | US food database (USDA SR Legacy) #173757 | C |
| Folate, food | 172 µg | 149.64 µg | 104.88 µg | listed used | US food database (USDA SR Legacy) #173757 | C |
| Folate, DFE | 172 µg | 149.64 µg | 104.88 µg | listed used | US food database (USDA SR Legacy) #173757 | C |
| Tryptophan | 0.085 g | 0.07 g | 0.05 g | listed used | US food database (USDA SR Legacy) #173757 | C |
| Threonine | 0.329 g | 0.29 g | 0.2 g | listed used | US food database (USDA SR Legacy) #173757 | C |
| Isoleucine | 0.38 g | 0.33 g | 0.23 g | listed used | US food database (USDA SR Legacy) #173757 | C |
| Leucine | 0.631 g | 0.55 g | 0.38 g | listed used | US food database (USDA SR Legacy) #173757 | C |
| Lysine | 0.593 g | 0.52 g | 0.36 g | listed used | US food database (USDA SR Legacy) #173757 | C |
| Methionine | 0.116 g | 0.1 g | 0.07 g | listed used | US food database (USDA SR Legacy) #173757 | C |
| Cystine | 0.119 g | 0.1 g | 0.07 g | listed used | US food database (USDA SR Legacy) #173757 | C |
| Phenylalanine | 0.475 g | 0.41 g | 0.29 g | listed used | US food database (USDA SR Legacy) #173757 | C |
| Tyrosine | 0.22 g | 0.19 g | 0.13 g | listed used | US food database (USDA SR Legacy) #173757 | C |
| Valine | 0.372 g | 0.32 g | 0.23 g | listed used | US food database (USDA SR Legacy) #173757 | C |
| Arginine | 0.835 g | 0.73 g | 0.51 g | listed used | US food database (USDA SR Legacy) #173757 | C |
| Histidine | 0.244 g | 0.21 g | 0.15 g | listed used | US food database (USDA SR Legacy) #173757 | C |
| Alanine | 0.38 g | 0.33 g | 0.23 g | listed used | US food database (USDA SR Legacy) #173757 | C |
| Aspartic acid | 1.042 g | 0.91 g | 0.64 g | listed used | US food database (USDA SR Legacy) #173757 | C |
| Glutamic acid | 1.55 g | 1.35 g | 0.95 g | listed used | US food database (USDA SR Legacy) #173757 | C |
| Glycine | 0.369 g | 0.32 g | 0.22 g | listed used | US food database (USDA SR Legacy) #173757 | C |
| Proline | 0.366 g | 0.32 g | 0.22 g | listed used | US food database (USDA SR Legacy) #173757 | C |
| Serine | 0.447 g | 0.39 g | 0.27 g | listed used | US food database (USDA SR Legacy) #173757 | C |
| Vitamin E, added | 0 mg | 0 mg | 0 mg | listed used | US food database (USDA SR Legacy) #173757 | C |
| Vitamin B-12, added | 0 µg | 0 µg | 0 µg | listed used | US food database (USDA SR Legacy) #173757 | C |
| Fatty acids, total trans | 0 g | 0 g | 0 g | listed used | US food database (USDA SR Legacy) #173757 | C |
| SFA 4:0 | 0 g | 0 g | 0 g | listed used | US food database (USDA SR Legacy) #173757 | C |
| SFA 6:0 | 0 g | 0 g | 0 g | listed used | US food database (USDA SR Legacy) #173757 | C |
| SFA 8:0 | 0 g | 0 g | 0 g | listed used | US food database (USDA SR Legacy) #173757 | C |
| SFA 10:0 | 0 g | 0 g | 0 g | listed used | US food database (USDA SR Legacy) #173757 | C |
| SFA 12:0 | 0 g | 0 g | 0 g | listed used | US food database (USDA SR Legacy) #173757 | C |
| SFA 14:0 | 0.004 g | 0 g | 0 g | listed used | US food database (USDA SR Legacy) #173757 | C |
| SFA 16:0 | 0.215 g | 0.19 g | 0.13 g | listed used | US food database (USDA SR Legacy) #173757 | C |
| SFA 18:0 | 0.037 g | 0.03 g | 0.02 g | listed used | US food database (USDA SR Legacy) #173757 | C |
| MUFA 18:1 | 0.578 g | 0.5 g | 0.35 g | listed used | US food database (USDA SR Legacy) #173757 | C |
| PUFA 18:2 | 1.113 g | 0.97 g | 0.68 g | listed used | US food database (USDA SR Legacy) #173757 | C |
| PUFA 18:3 | 0.043 g | 0.04 g | 0.03 g | listed used | US food database (USDA SR Legacy) #173757 | C |
| PUFA 20:4 | 0 g | 0 g | 0 g | listed used | US food database (USDA SR Legacy) #173757 | C |
| PUFA 22:6 n-3 (DHA) | 0 g | 0 g | 0 g | listed used | US food database (USDA SR Legacy) #173757 | C |
| MUFA 16:1 | 0.005 g | 0 g | 0 g | listed used | US food database (USDA SR Legacy) #173757 | C |
| PUFA 18:4 | 0 g | 0 g | 0 g | listed used | US food database (USDA SR Legacy) #173757 | C |
| MUFA 20:1 | 0 g | 0 g | 0 g | listed used | US food database (USDA SR Legacy) #173757 | C |
| PUFA 20:5 n-3 (EPA) | 0 g | 0 g | 0 g | listed used | US food database (USDA SR Legacy) #173757 | C |
| MUFA 22:1 | 0 g | 0 g | 0 g | listed used | US food database (USDA SR Legacy) #173757 | C |
| PUFA 22:5 n-3 (DPA) | 0 g | 0 g | 0 g | listed used | US food database (USDA SR Legacy) #173757 | C |
| Fatty acids, total monounsaturated | 0.583 g | 0.51 g | 0.36 g | listed used | US food database (USDA SR Legacy) #173757 | C |
| Fatty acids, total polyunsaturated | 1.156 g | 1.01 g | 0.7 g | listed used | US food database (USDA SR Legacy) #173757 | C |
| Lutein + zeaxanthin | 0 µg | 0 µg | 0 µg | listed used | US food database (USDA SR Legacy) #173757 | C |
| Manganese | 1.03 mg | 0.9 mg | 0.63 mg | listed used | US food database (USDA SR Legacy) #173757 | C |
| 1.38 mg | 1.2 mg | 0.84 mg | second database · not used | UK food tables (CoFID 2021) #13-662 | C | |
| Niacin (B3, preformed) | 0.526 mg | 0.46 mg | 0.32 mg | listed used | US food database (USDA SR Legacy) #173757 | C |
| 0.7 mg | 0.61 mg | 0.43 mg | second database · not used | UK food tables (CoFID 2021) #13-662 | C | |
| Pantothenic acid (B5) | 0.286 mg | 0.25 mg | 0.17 mg | listed used | US food database (USDA SR Legacy) #173757 | C |
| 0.37 mg | 0.32 mg | 0.23 mg | second database · not used | UK food tables (CoFID 2021) #13-662 | C | |
| Retinol | 0 µg | 0 µg | 0 µg | listed used | US food database (USDA SR Legacy) #173757 | C |
| 0 µg | 0 µg | 0 µg | second database · not used | UK food tables (CoFID 2021) #13-662 | C |
Change the amount to rescale the first column. Nutrients a database doesn't list are missing, not zero.
Absorption studies
Studies of how much of a nutrient gets in; those done in animals are marked. This page quotes a figure only from a study that passes our screen: adults, graded A, of this food in this preparation, with a test dose on record and a source that has passed our evidence check. The exception is calcium on our calcium card: its figure comes from the card’s own study, checked with the card, and is marked “used” even where that study misses a step of this screen. The others are listed so nothing is hidden, each with the first check it fails.
No study of this food passes the screen yet, so no absorption figure is quoted.
| Study | Nutrient | Absorbed | Test dose | People | Grade | On this page |
|---|---|---|---|---|---|---|
| Kashyap 2019: chickpea, mean of 7 indispensable amino acids (true ileal digestibility) kabuli chickpea (var. KAK-2), intrinsically 2H-labelled, grown at UAS Bengaluru · soaked 12 h, pressure cooked 15 min in the remaining soaking water, eaten in a ghee-rice and tomato-curry meal (plateau feeding, 8 h) · load not reported for chickpea protein alone: the whole test meal carried 21.5 g protein (Table 1: 21.5 ± 2.8 g), legumes supplying two-thirds of meal protein full text read | Protein | 74.6 % | not reported | 6 | A | Not used: no test dose on record. |
| Kashyap 2019: chickpea, lysine (true ileal digestibility) kabuli chickpea (var. KAK-2), 2H-labelled · as arm 1 (soaked 12 h, pressure cooked 15 min) · load not reported for chickpea protein alone: whole meal protein 21.5 g, legume two-thirds of it full text read | Lysine | 60 % | not reported | 6 | A | Not used: no test dose on record. |
| Kashyap 2019: chickpea, methionine (true ileal digestibility) kabuli chickpea (var. KAK-2), 2H-labelled · as arm 1 (soaked 12 h, pressure cooked 15 min) · load not reported for chickpea protein alone: whole meal protein 21.5 g, legume two-thirds of it full text read | Methionine | 71.8 % | not reported | 6 | A | Not used: no test dose on record. |
| Kashyap 2024: chickpea, tryptophan (true digestibility, banked samples) 2H-intrinsically labelled chickpea · not stated; samples were 'banked from earlier studies' · load not reported abstract only | Tryptophan | 72.6 % | not reported | 5 | A | Not used: we haven’t confirmed how the food was prepared in this study. |
| Rafii 2020: chickpea methionine metabolic availability (IAAO) Canadian chickpeas, cultivar not stated · 'cooked Canadian chickpeas'; canned or dry-boiled not stated · load not reported: 3 chickpea methionine intakes tested, values not stated; reference diet 0.5, 1, 2, 3 mg/kg/d abstract only | Methionine | – | not reported | 11 | A | Not used: it measures something other than the share absorbed. |
| Devi 2020: extruded chickpea, mean amino acid digestibility (children) not stated · extruded chickpea (children) · load not reported abstract only | Protein | 89 % | not reported | – | A | Not used: no test dose on record. |
| Uyoga 2022: fractional iron absorption from an infant cereal with whole-grain wheat and chickpea flour (fortificant iron) commercial product; chickpea share not stated · commercial infant cereal containing whole-grain wheat and chickpea flour, with added ferrous fumarate and ascorbic acid abstract only | Iron | 12.8 % | 2 mg | 30 | C | Not used: not graded A, so not a direct human study of this food and preparation. |
| Devi et al. 2018: chickpeas desi chickpea, Indian variety JG11 · chickpea curry pressure cooked 25 min (local recipe), eaten with ghee rice; intrinsically 2H-labelled · load not reported full text read | Protein | 56.6 % | not reported | 1 | B | Not used: we haven’t confirmed how the food was prepared in this study. |
| Hodgkinson et al. 2025: chickpeas (pig) animal study black chickpeas (kala chana), dried; variant of chickpeas · Soaked, pressure cooked in water then lightly mashed · diet protein level not read; ration 0.08 x metabolic body weight (kg^0.75) per day full text read | Protein | 71.8 % | not reported | 6 | B | Not used: we haven’t confirmed how the food was prepared in this study. |
Hazard rows as the dataset rates them
- Cadmium · Nothing to watch: under the limit · A daily serving adds 0.64% to an average adult's cadmium intake (EFSA 2012 adult median, 1.77 µg/kg body weight/week; Canadian adults in 2007: 1.2-1.75), far from doubling it, so no cap. · US FDA Total Diet Study (2018–2020) · B
- Chickpea allergy · Context · Chickpea is not on Health Canada's priority allergen list; no agency source naming chickpea or legume cross-reactivity was found · Health Canada, priority allergens · A
- Lead · Nothing to watch: doesn’t double average intake · lower bound 0, upper bound 4 µg/kg; at most +0.9-1.0% to the EFSA average of 35 µg/day · US FDA Total Diet Study (2018–2020) · B
- Phytohaemagglutinin (raw bean lectins) · Context · Context, not a rating. Health Canada's lectin cooking advice is written for dry red kidney beans, and its statement that canning heat destroys the lectins is about canned red kidney beans ("in canned red kidney beans, which do not require further cooking"), not canned legumes in general. Chickpeas are not named: Foodtopsy raises no lectin flag for boiled or canned chickpeas, but the agency page does not itself clear them. · Health Canada, Lectins in Dry Legumes · B
Oxalate, phytate and gut-tolerance measurements
- fodmap excess fructose: none (fructose not above glucose) g/100 g · dry matter · raw chickpea flour, as supplied · grade A · Ispiryan 2020
- fodmap fos: fructo-oligosaccharides, two market classes g per '100-g serving' · not stated ('100-g serving'; dry or cooked weight not given) · cooked at 90 C for 4 h · grade B · PubMed 32180222
- fodmap fructan: not detected g/100 g · dry matter · raw chickpea flour, as supplied · grade A · Ispiryan 2020
- fodmap fructan: not detected g/100 g · dry matter · raw whole chickpea seeds · grade B · Ispiryan 2021
- fodmap fructan: 0.13 g/100 g · as analysed (preparation and basis not stated) · channa dal (raw, cooked or split not stated) · grade B · Prichard 2016
- fodmap gos: raffinose-family oligosaccharides (RFO: raffinose, stachyose, verbascose); two chickpea market classes g per '100-g serving' · not stated ('100-g serving'; dry or cooked weight not given) · cooked at 90 C for 4 h (soaking not stated) · grade B · PubMed 32180222
- fodmap gos: total alpha-galacto-oligosaccharides, RAW chickpea (lowest of the five legumes) g/100 g (printed as 2500 mg/100 g) · not stated · raw seeds · grade B · PubMed 30614326
- fodmap gos: 2.11 g/100 g · dry matter · raw chickpea flour, as supplied · grade A · Ispiryan 2020
- fodmap gos: 2.113 g/100 g · as purchased (dry or fresh weight not stated) · chickpea flour, as sold · grade A · Natale 2025
- fodmap gos: 3.86 g/100 g · dry matter · raw whole chickpea seeds (unmalted control of a malting experiment) · grade B · Ispiryan 2021
- fodmap gos: 1.3 g/100 g · g/100 g as headed in the table (dried flours; dry weight not stated) · raw seed · grade B · Perez 2023
- fodmap gos: 1.07 g/100 g · g/100 g as headed in the table (dried flours; dry weight not stated) · raw seed · grade B · Perez 2023
- fodmap gos: 1.13 g/100 g · g/100 g as headed in the table (dried flours; dry weight not stated) · raw seed · grade B · Perez 2023
- fodmap gos: 0.36 g/100 g · as analysed (preparation and basis not stated) · channa dal · grade B · Prichard 2016
- fodmap gos: 2.49 g/100 g · dry matter (2487 +/- 37 mg/100 g dry matter) · raw whole chickpea seeds (Cicer arietinum), ground; bought at a local market in Tunis, Tunisia · grade A · Njoumi 2019
- fodmap polyols: sugar alcohols (SAs) as the paper defines them; which polyols not in the abstract g per '100-g serving' · not stated ('100-g serving'; dry or cooked weight not given) · cooked at 90 C for 4 h · grade B · PubMed 32180222
- fodmap polyols: not detected g/100 g · dry matter · raw chickpea flour, as supplied · grade A · Ispiryan 2020
- histamine: not detected (nd) mg/kg · fresh weight · not stated (market product); reported per kg fresh weight · grade B · Sanchezperez 2018
- lactose: not detected g/100 g · dry matter · raw chickpea flour, as supplied · grade A · Ispiryan 2020
- lactose: not detected g/100 g · dry matter · raw whole chickpea seeds · grade B · Ispiryan 2021
- oxalate soluble: approximately 24-72% of total oxalate soluble, all investigated pulses (chickpea-specific share not in the abstract) % of total · share of total oxalate, all pulses · raw, soaked or cooked pulses · grade B · PubMed 29580532
- oxalate total: range across samples and treatments (raw, soaked, cooked not separable in the abstract) mg/100 g · not stated · raw, soaked or cooked Canadian chickpeas; which value is cooked not stated · grade B · PubMed 29580532
- phytate: mean 693.94, +/- 40.67 (table footnote says standard deviation, methods say standard error); n = 3-4 mg/100 g · fresh weight: cooked, drained, rinsed product (phytic acid; dry matter 38.09 g/100 g) · household-cooked: soaked overnight, boiled 2 h in mineral water, drained, rinsed · grade A · PubMed 30400385
- tyramine: not detected (nd) mg/kg · fresh weight · not stated (market product); reported per kg fresh weight · grade B · Sanchezperez 2018
Sources
- Health Canada, Canadian Nutrient File 2026 (14th edition)
cnf-2026· dataset · Open Government Licence – Canada 2.0 - Public Health England, Composition of Foods Integrated Dataset (CoFID) 2021
cofid-2021· dataset · Open Government Licence v3.0 - US FDA, Total Diet Study FY2018–FY2020 Elements Report Supplement
fda-tds-fy2018-2020· dataset · US government work (17 USC 105), public domain - USDA FoodData Central, SR Legacy, 2018-04
fdc-sr-legacy-2018-04· dataset · CC0 1.0 (public domain) - Health Canada, Lectins in Dry Legumes (page details date 2017-05-04)
hc-lectins-legumes· page · Government of Canada terms - Health Canada, Common food allergens (priority allergens list)
hc-priority-allergens· page · Government of Canada terms (Crown copyright; not OGL) - Ispiryan L, Zannini E, Arendt EK. Characterization of the FODMAP-profile in cereal-product ingredients. J Cereal Sci 2020;92:102916. · doi:10.1016/j.jcs.2020.102916
ispiryan-2020-jcs· full text read · CC BY-NC-ND 4.0 (accepted manuscript) - Ispiryan L. FODMAPs in cereals, pseudo cereals and legumes: a systematic approach for the development of functional low FODMAP products. PhD thesis, University College Cork, 2021 (Chapter 5, Table 5-3, raw and malted seeds; chapter published as Ispiryan L, Kuktaite R, Zannini E, Arendt EK, Food Chem 2021; 343:128549).
ispiryan-2021-thesis· full text read · unknown - Natale A, Fiori F, Turati F, La Vecchia C, Parpinel M, Rossi M, et al. Quantification of naturally occurring prebiotics in selected foods. Nutrients 2025;17(4):683. · doi:10.3390/nu17040683 · PMID 40005011
natale-2025-nutrients· full text read · CC BY 4.0 - Njoumi S, Josephe Amiot M, Rochette I, Bellagha S, Mouquet-Rivier C. Soaking and cooking modify the alpha-galacto-oligosaccharide and dietary fibre content in five Mediterranean legumes. Int J Food Sci Nutr 2019;70:551-561. · doi:10.1080/09637486.2018.1544229
njoumi-2019-ijfsn· full text read · unknown - Perez-Ramirez IF, Escobedo-Alvarez DL, Mendoza-Sanchez M, Rocha-Guzman NE, et al. Phytochemical profile and composition of chickpea (Cicer arietinum L.): varietal differences and effect of germination under elicited conditions. Plants 2023;12(17):3093. · doi:10.3390/plants12173093 · PMID 37687340
perez-ramirez-2023-plants· full text read · CC BY 4.0 (open access) - Shi L, Arntfield SD, Nickerson M. Changes in levels of phytic acid, lectins and oxalates during soaking and cooking of Canadian pulses. Food Res Int 2018;107:660-8 · doi:10.1016/j.foodres.2018.02.056 · PMID 29580532
pmid:29580532· abstract only · Publisher copyright (journal article) - Margier M, Georgé S, Hafnaoui N, Remond D, Nowicki M, Du Chaffaut L, Amiot MJ, Reboul E. Nutritional composition and bioactive content of legumes: characterization of pulses frequently consumed in France and effect of the cooking method. Nutrients 2018;10(11):1668 · doi:10.3390/nu10111668 · PMID 30400385
pmid:30400385· full text read · MDPI open access (CC BY assumed from the publisher; not re-checked this session) - Njoumi S, Josephe Amiot M, Rochette I, Bellagha S, Mouquet-Rivier C. Soaking and cooking modify the alpha-galacto-oligosaccharide and dietary fibre content in five Mediterranean legumes. Int J Food Sci Nutr 2019 · doi:10.1080/09637486.2018.1544229 · PMID 30614326
pmid:30614326· abstract only · Publisher copyright (journal article) - Kashyap S, Varkey A, Shivakumar N, Devi S, Reddy BHR, Thomas T, Preston T, Sreeman S, Kurpad AV. True ileal digestibility of legumes determined by dual-isotope tracer method in Indian adults. Am J Clin Nutr 2019;110(4):873-882 · doi:10.1093/ajcn/nqz159 · PMID 31374575
pmid:31374575· full text read · open access via PMC (licence not checked this session) - Devi S, Varkey A, Dharmar M, Holt RR, Allen LH, Sheshshayee MS, Preston T, Keen CL, Kurpad AV. Amino acid digestibility of extruded chickpea and yellow pea protein is high and comparable in moderately stunted South Indian children with use of a dual stable isotope tracer method. J Nutr 2020;150(5):1178-1185 · doi:10.1093/jn/nxaa004 · PMID 32006007
pmid:32006007· abstract only · Publisher copyright (journal article) - Siva N, Thavarajah P, Thavarajah D. Prebiotic carbohydrate concentrations of common bean and chickpea change during cooking, cooling, and reheating. J Food Sci 2020 · doi:10.1111/1750-3841.15066 · PMID 32180222
pmid:32180222· abstract only · Publisher copyright (journal article) - Rafii M, Pencharz PB, Ball RO, Tomlinson C, Elango R, Courtney-Martin G. Bioavailable methionine assessed using the indicator amino acid oxidation method is greater when cooked chickpeas and steamed rice are combined in healthy young men. J Nutr 2020;150(7):1834-1844 · doi:10.1093/jn/nxaa086 · PMID 32271919
pmid:32271919· abstract only · Publisher copyright (journal article) - Uyoga MA, Mzembe G, Stoffel NU, Moretti D, Zeder C, Phiri K, Sabatier M, Hays NP, Zimmermann MB, Mwangi MN. Iron bioavailability from infant cereals containing whole grains and pulses: a stable isotope study in Malawian children. J Nutr 2022;152(3):826-834 · doi:10.1093/jn/nxab406 · PMID 34958374
pmid:34958374· abstract only · open access via PMC (licence not checked this session) - Kashyap S, Devi S, Pasanna RM, Preston T, Kurpad AV. True digestibility of tryptophan in plant and animal protein. J Nutr 2024;154(11):3203-3209 · doi:10.1016/j.tjnut.2024.09.014 · PMID 39307282
pmid:39307282· abstract only · Publisher copyright (journal article) - Devi S, Varkey A, Sheshshayee MS, Preston T, Kurpad AV. Measurement of protein digestibility in humans by a dual-tracer method. Am J Clin Nutr 2018;107:984-991. · doi:10.1093/ajcn/nqy062 · PMID 29771297
pq_devi2018· full text read · CC BY (Europe PMC licence field, PMC6179135) - Hodgkinson SM, Stroebinger N, Stein HH, Fanelli NS, de Vries S, van der Wielen N, et al. True ileal amino acid digestibility of human foods classified according to food type as determined in the growing pig. J Nutr 2025;155:3384-3400. · doi:10.1016/j.tjnut.2025.08.004 · PMID 40812478
pq_hodgkinson2025· full text read · CC BY (Europe PMC licence field) - Prichard R, Rossi M, Muir J, Yao C, Whelan K, Lomer M. Fermentable oligosaccharide, disaccharide, monosaccharide and polyol content of foods commonly consumed by ethnic minority groups in the United Kingdom. Int J Food Sci Nutr 2016;67:383-390. · doi:10.3109/09637486.2016.1163328 · PMID 27002546
prichard-2016-ijfsn· abstract only · unknown - Sánchez-Pérez S et al. 2018, Foods 7:205, Table 1 (histamine in plant foods; PMC6306728)
sanchezperez2018· full text read · CC BY 4.0
Body map 2026-10-25.1: each nutrient’s job comes from an agency fact sheet, linked beside it under Good for.
The plain words: “a lot” means one serving (100 g when the food has no serving size) gives at least 20% of the daily amount (the reference intake), “some” at least 10%, “a little” at least 2% (the cut-offs are ours, one set for every page: 20% and 10% are borrowed from the US labelling terms “high” and “good source” and applied to Health Canada’s daily amount, whereas Health Canada’s own shopper rule says 15%; provisional: they may change in a later method version). The daily amount is Health Canada’s Dietary Reference Intake for adults 19–30; where men and women need different amounts we use the higher one (protein: 56 g for men, 46 g for women). The percentage printed under each nutrient is the printed amount as a share of that daily amount, rounded to the nearest whole number, and the word is read from that percentage, so the amount, the percentage and the word always agree. Calcium with a measured absorption is scaled by how well it gets in compared with milk.
The scale: “Nothing to watch” means a serving a day stays under the limit at ordinary amounts; “Go easy” means a serving a day can push past the limit for adults who already take in the most, or fewer than 2 servings reach it; “Limit it” means once a week or less. The dataset’s own rating is under “How we got this”. Provisional: the scale may change in a later method version.
Measured absorption under Good for: grade-A studies in adults that tested this preparation of this food, as a share of the listed amount (the share digested, for protein), quoted once each source has passed our evidence check; animal studies and other variants stay in the table above. Provisional: this screen may change in a later method version.