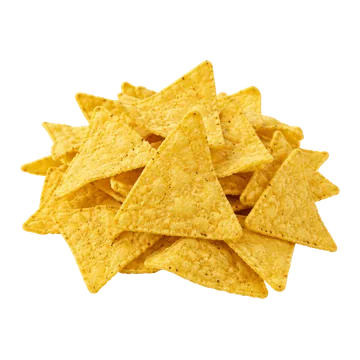
Tortilla chips
Checked by us One serving: 50 g · 236 kcal
Some vitamin E and magnesium.
Worth knowing: aflatoxins.
Good for
How we counted this
What one serving (50 g) gives you.
Your body needs enough of each of these. Past enough, more doesn’t help. Amounts are what the food databases list, not what your body absorbs, unless a row says it was measured.
The words: “A lot” means one serving gives 20% or more of Health Canada’s daily amount, “Some” 10% to 19%, “A little” 2% to 9%, “Almost none” under 2%. Strongest word first; within a word, protein and fibre lead, then the biggest share. ?
A milligram (mg) is a thousandth of a gram, and a microgram (µg) a thousandth of a milligram: 1,000 µg make 1 mg.
- Some
Vitamin E
Shields the fats in your cells from damage; your immune system uses it too.
Learn more
1.77 mg in one serving: 12% of the 15 mg a day.
Source: How much of it gets in hasn’t been measured for this food yet. NIH Office of Dietary Supplements, vitamin E fact sheet for health professionals
- Some
Magnesium
Your muscles and nerves need it to work.
Learn more
42 mg in one serving: 11% of the 400 mg a day men need, 14% of the 310 mg women need. The word follows the smaller share, which is the share of the higher amount. ?
Source: How much of it gets in hasn’t been measured for this food yet. NIH Office of Dietary Supplements, magnesium fact sheet for health professionals
20 more nutrients at a little or less
- A little
Vitamin K1
Your blood needs it to clot.
Learn more
10.5 µg in one serving: 9% of the 120 µg a day men need, 12% of the 90 µg women need. The word follows the smaller share, which is the share of the higher amount. ?
Source: How much of it gets in hasn’t been measured for this food yet. NIH Office of Dietary Supplements, vitamin K fact sheet for health professionals
- A little
Vitamin B12
Your body needs it to make red blood cells and keep nerves working.
Learn more
0.18 µg in one serving: 8% of the 2.4 µg a day.
Source: How much of it gets in hasn’t been measured for this food yet. NIH Office of Dietary Supplements, vitamin B12 fact sheet for health professionals
- A little
Omega-3: ALA
The one omega-3 your body can’t make: it must come from food. Your cells build it into their membranes and burn it for energy.
Learn more
116 mg in one serving: 7% of the 1,600 mg a day men need, 11% of the 1,100 mg women need. The word follows the smaller share, which is the share of the higher amount. ?
Source: How much of it gets in hasn’t been measured for this food yet. NIH Office of Dietary Supplements, omega-3 fatty acids fact sheet for health professionals
- A little
Fibre
Keeps your gut moving.
Learn more
2.7 g in one serving: 7% of the 38 g a day men need, 11% of the 25 g women need. The word follows the smaller share, which is the share of the higher amount. ?
Source: How much of it gets in hasn’t been measured for this food yet. Institute of Medicine 2005, Dietary Reference Intakes for Energy, Carbohydrate, Fiber, Fat, Fatty Acids, Cholesterol, Protein, and Amino Acids
- A little
Vitamin B6
Helps you use protein, and your brain needs it to make its chemical messengers.
Learn more
0.09 mg in one serving: 7% of the 1.3 mg a day.
Source: How much of it gets in hasn’t been measured for this food yet. NIH Office of Dietary Supplements, vitamin B6 fact sheet for health professionals
- A little
Niacin (B3, niacin equivalents)
More than 400 of your enzymes need it to work.
Learn more
1.07 mg in one serving: 7% of the 16 mg a day men need, 8% of the 14 mg women need. The word follows the smaller share, which is the share of the higher amount. ?
Source: How much of it gets in hasn’t been measured for this food yet. NIH Office of Dietary Supplements, niacin fact sheet for health professionals
- A little
Protein
Your muscles, and every other tissue, are built and repaired from it.
Learn more
3.55 g in one serving: 6% of the 56 g a day men need, 8% of the 46 g women need. The word follows the smaller share, which is the share of the higher amount. ?
Source: How much of it gets in hasn’t been measured for this food yet. Institute of Medicine 2005, Dietary Reference Intakes for Energy, Carbohydrate, Fiber, Fat, Fatty Acids, Cholesterol, Protein, and Amino Acids
- A little
Zinc
Your immune system and healing wounds depend on it.
Learn more
0.69 mg in one serving: 6% of the 11 mg a day men need, 9% of the 8 mg women need. The word follows the smaller share, which is the share of the higher amount. ?
Source: How much of it gets in hasn’t been measured for this food yet. NIH Office of Dietary Supplements, zinc fact sheet for health professionals
- A little
Thiamin (B1)
Your cells use it to get energy from food, and so to grow and work.
Learn more
0.07 mg in one serving: 6% of the 1.2 mg a day men need, 6% of the 1.1 mg women need. The word follows the smaller share, which is the share of the higher amount. ?
Source: How much of it gets in hasn’t been measured for this food yet. NIH Office of Dietary Supplements, thiamin fact sheet for health professionals
- A little
Calcium
Builds your bones and teeth.
Learn more
53 mg in one serving: 5% of the 1,000 mg a day.
Source: How much of it gets in hasn’t been measured for this food yet. NIH Office of Dietary Supplements, calcium fact sheet for health professionals
- A little
Iron
Carries oxygen in your blood.
Learn more
0.76 mg in one serving: 10% of the 8 mg a day men need, 4% of the 18 mg women need. The word follows the smaller share, which is the share of the higher amount. ?
Source: How much of it gets in hasn’t been measured for this food yet. NIH Office of Dietary Supplements, iron fact sheet for health professionals
- A little
Selenium
Your thyroid uses it to make its hormones.
Learn more
2.2 µg in one serving: 4% of the 55 µg a day.
Source: How much of it gets in hasn’t been measured for this food yet. NIH Office of Dietary Supplements, selenium fact sheet for health professionals
- A little
Riboflavin (B2)
Your cells use it to make energy and handle fats. It also helps turn tryptophan into niacin and activate vitamin B6.
Learn more
0.04 mg in one serving: 3% of the 1.3 mg a day men need, 4% of the 1.1 mg women need. The word follows the smaller share, which is the share of the higher amount. ?
Source: How much of it gets in hasn’t been measured for this food yet. NIH Office of Dietary Supplements, riboflavin fact sheet for health professionals
- A little
Potassium
Your nerves, muscles and kidneys need it to work.
Learn more
91 mg in one serving: 3% of the 3,400 mg a day men need, 4% of the 2,600 mg women need. The word follows the smaller share, which is the share of the higher amount. ?
Source: How much of it gets in hasn’t been measured for this food yet. NIH Office of Dietary Supplements, potassium fact sheet for health professionals
- A little
Choline
Your cells need it for their membranes, and to make acetylcholine, a messenger for memory, mood and muscle control.
Learn more
9.7 mg in one serving: 2% of the 550 mg a day men need, 2% of the 425 mg women need. The word follows the smaller share, which is the share of the higher amount. ?
Source: How much of it gets in hasn’t been measured for this food yet. NIH Office of Dietary Supplements, choline fact sheet for health professionals
- A little
Folate
Your body needs it to make DNA and to divide new cells.
Learn more
6 µg in one serving: 2% of the 400 µg a day.
Source: How much of it gets in hasn’t been measured for this food yet. NIH Office of Dietary Supplements, folate fact sheet for health professionals
- Almost none
Omega-3: EPA + DHA
Long-chain omega-3s, built into your cell membranes. DHA is concentrated in your brain and retinas.
Learn more
0 mg in one serving: under 1% of the 250 mg a day.
Health Canada sets no daily amount for these fats, so the daily figure here is the European Food Safety Authority’s.
Source: How much of it gets in hasn’t been measured for this food yet. NIH Office of Dietary Supplements, omega-3 fatty acids fact sheet for health professionals
- Almost none
Vitamin A
Your eyes need it to see in dim light.
Learn more
Getting enough matters; more than enough doesn’t sharpen your sight.
0 µg in one serving: under 1% of the 900 µg a day men need, under 1% of the 700 µg women need. The word follows the smaller share, which is the share of the higher amount. ?
Source: How much of it gets in hasn’t been measured for this food yet. NIH Office of Dietary Supplements, vitamin A fact sheet for health professionals
- Almost none
Vitamin C
Your body makes collagen with it, which wounds need to heal. It also helps you absorb iron from plants.
Learn more
0 mg in one serving: under 1% of the 90 mg a day men need, under 1% of the 75 mg women need. The word follows the smaller share, which is the share of the higher amount. ?
Source: How much of it gets in hasn’t been measured for this food yet. NIH Office of Dietary Supplements, vitamin C fact sheet for health professionals
- Almost none
Vitamin D
Your body needs it to absorb calcium and keep your bones hard.
Learn more
Your skin also makes it in sunlight, so food is only one of its sources.
0 µg in one serving: under 1% of the 15 µg a day.
Source: How much of it gets in hasn’t been measured for this food yet. NIH Office of Dietary Supplements, vitamin D fact sheet for health professionals
Watch out
How we counted this
Flagged: no safe threshold is set for aflatoxins (EFSA 2020, benchmark dose lower limit (BMDL10) 0.4 µg/kg body weight/day for aflatoxin B1; a margin of exposure of 10,000 counts as low concern). None of the 18 samples had any aflatoxin, so a serving adds 0 at the lower bound. The upper bound cannot be built because the survey publishes no detection limit, so this stays a flag, not a number. Adult averages are 0.22-0.49 ng/kg body weight/day (lower bound), 1.35-3.25 (upper).
Learn more
1 other measurement of this food, same verdict
Flagged: no safe threshold is set for aflatoxins. As an illustration only, if every serving carried the 0.8 ppb average of positive samples, 50 g would be 40 ng, 0.57 ng/kg body weight: 117-260% of the lower-bound adult mean (0.22-0.49) but 18-42% of the upper-bound mean (1.35-3.25 ng/kg body weight/day), with a margin of exposure of about 700 against the benchmark dose lower limit (BMDL10). The real category mean is lower (86% of corn products had no aflatoxin; the sub-category sample size is unpublished), so this is a flag, not a number.
You’d need about 4.4 servings in a day of this food alone to use up what the highest average adult intake we found leaves under the limit.
Learn more
One serving carries 4.78 µg
How we got this
A serving a day adds 9.7–23% to what an average adult already takes in: a share of that intake, not of the limit. With that serving every day, an average adult would be at about 77–86% of the limit.
The highest average adult intake we found already takes up about 70% of the limit. One serving a day fits in the room left.
Counted from zero, with no allowance for what adults already take in from other food, 730 g a day would reach the limit.
Why this rating: Eating it daily comes to 50 g a day, which stays within the 220 g of room left before the limit.
general_acute: 5,900 g in one sitting.
The dataset’s rating: Nothing to watch: under the limit
No cap: EFSA's group tolerable daily intake for deoxynivalenol is 1 µg/kg body weight/day (70 µg/day). A 50 g serving carries 4.78 µg, 6.8% of it, and adds 9.7-22.7% to the adult mean (21-49 µg/day), under doubling; about 733 g a day would reach the limit, eaten alone. One sample at 1,440 ng/g would put a serving at 72 µg, 103% of it: an observed extreme, not the basis of the rating. This 2010-11 row is 17 times the 2018-19 row; both are shown, neither is averaged, and the older one is flagged for recency.
1 other measurement of this food, same verdict
You’d need about 76 servings in a day of this food alone to use up what the highest average adult intake we found leaves under the limit.
Learn more
One serving carries 0.28 µg
How we got this
A serving a day adds 0.6–1.3% to what an average adult already takes in: a share of that intake, not of the limit. With that serving every day, an average adult would be at about 70–71% of the limit.
The highest average adult intake we found already takes up about 70% of the limit. One serving a day fits in the room left.
Counted from zero, with no allowance for what adults already take in from other food, 13,000 g a day would reach the limit.
Why this rating: Eating it daily comes to 50 g a day, which stays within the 3,800 g of room left before the limit.
general_acute: 100,000 g in one sitting.
The dataset’s rating: Nothing to watch: under the limit
No cap: EFSA's group tolerable daily intake for deoxynivalenol is 1 µg/kg body weight/day (70 µg/day, 2017). A 50 g serving carries 0.278 µg, 0.40% of it, and adds 0.6-1.3% to the adult mean (0.3-0.7 µg/kg body weight/day = 21-49 µg/day). No more than about 12,600 g of chips a day would reach the limit, eaten alone; for a single sitting (acute reference dose 8 µg/kg body weight, 560 µg), about 100,000 g.
You’d need about 4 servings a day, every day, of this food alone to double the acrylamide an average adult already gets. No dose is known to be safe, so doubling is where we flag.
Learn more
A serving a day adds 14–31% to what an average adult already takes in. There is no limit to take a share of.
One serving carries 8.6 µg
How we got this
The dataset’s rating: Nothing to watch: doesn’t double average intake
No cap: no safe threshold is set for acrylamide; EFSA (2015) counts a margin of exposure of 10,000 on a benchmark dose lower limit (BMDL10) of 0.17 mg/kg body weight/day as low concern. A 50 g serving is 8.6 µg (0.123 µg/kg body weight) and adds 14-31% to EFSA's adult mean intake (0.4-0.9 µg/kg body weight/day), under doubling. The serving alone has a margin of about 1380; the average adult's is 189-425, both far below 10,000. Based on three samples.
2 other measurements of this food, same verdict
You’d need about 3 servings a day, every day, of this food alone to double the acrylamide an average adult already gets. No dose is known to be safe, so doubling is where we flag.
Learn more
A serving a day adds 20–46% to what an average adult already takes in. There is no limit to take a share of.
One serving carries 12.8 µg
How we got this
The dataset’s rating: Nothing to watch: doesn’t double average intake
No cap: no safe threshold is set for acrylamide; EFSA (2015) counts a margin of exposure of 10,000 on a benchmark dose lower limit (BMDL10) of 0.17 mg/kg body weight/day as low concern. A 50 g serving is 12.8 µg (0.182 µg/kg body weight) and adds 20-46% to EFSA's adult mean intake (0.4-0.9 µg/kg body weight/day), under doubling. The serving alone has a margin of about 930; the average adult's is 189-425, both far below 10,000.
You’d need about 4 servings a day, every day, of this food alone to double the acrylamide an average adult already gets. No dose is known to be safe, so doubling is where we flag.
Learn more
A serving a day adds 13–28% to what an average adult already takes in. There is no limit to take a share of.
One serving carries 7.91 µg
How we got this
The dataset’s rating: Nothing to watch: doesn’t double average intake
No cap: no safe threshold is set for acrylamide; EFSA (2015) counts a margin of exposure of 10,000 on a benchmark dose lower limit (BMDL10) of 0.17 mg/kg body weight/day as low concern. A 50 g serving is 7.9 µg (0.113 µg/kg body weight) and adds 13-28% to EFSA's adult mean intake (0.4-0.9 µg/kg body weight/day), under doubling. The serving alone has a margin of about 1500; the average adult's is 189-425, both far below 10,000.
Checked for nickel, fumonisins, cadmium, ochratoxin A and lead: fine at normal amounts.
You’d need about 70 servings in a day of this food alone to use up what the highest average adult intake we found leaves under the limit.
Learn more
One serving carries 9.67 µg
How we got this
A serving a day adds 4.1–4.8% to what an average adult already takes in: a share of that intake, not of the limit. With that serving every day, an average adult would be at about 27% of the limit.
The highest average adult intake we found already takes up about 26% of the limit. One serving a day fits in the room left.
Counted from zero, with no allowance for what adults already take in from other food, 4,700 g a day would reach the limit.
Why this rating: Eating it daily comes to 50 g a day, which stays within the 3,500 g of room left before the limit.
The dataset’s rating: Nothing to watch: under the limit
No cap: nickel is rated against EFSA's tolerable daily intake of 13 µg/kg body weight/day (2020). The average adult already takes in 22-26% of it, under half, so a food would have to reach the limit on its own to matter. A 50 g serving carries 9.67 µg, 1.06% of the limit, and adds 2.7-10.6% to the adult mean (90-361 µg/day); about 4,700 g of chips a day would reach it, eaten alone.
Health Canada, Canadian Total Diet Study – Trace Elements (2005–2018 composites) · grade A
1 other measurement of this food, same verdict
You’d need about 96 servings in a day of this food alone to use up what the highest average adult intake we found leaves under the limit.
Learn more
One serving carries 7 µg
How we got this
A serving a day adds 2.9–3.4% to what an average adult already takes in: a share of that intake, not of the limit. With that serving every day, an average adult would be at about 27% of the limit.
The highest average adult intake we found already takes up about 26% of the limit. One serving a day fits in the room left.
Counted from zero, with no allowance for what adults already take in from other food, 6,500 g a day would reach the limit.
Why this rating: Eating it daily comes to 50 g a day, which stays within the 4,800 g of room left before the limit.
The dataset’s rating: Nothing to watch: under the limit
No cap: nickel is rated against EFSA's tolerable daily intake of 13 µg/kg body weight/day (2020). The average adult already takes in 22-26% of it, under half, so a food would have to reach the limit on its own to matter. A 50 g serving carries 7.0 µg, 0.77% of the limit; about 6,500 g of chips a day would reach it, eaten alone. A second source, beside the Canadian row.
US FDA, Total Diet Study FY2018–FY2020 Elements Report Supplement · grade A
Fumonisins
Nothing to watchYou’d need more than 100 servings in a day of this food alone to reach the limit.
Learn more
One serving carries 0.67 µg
How we got this
5,200 g a day reaches the limit
The dataset’s rating: Nothing to watch: under the limit
No cap: EFSA's group tolerable daily intake for fumonisins is 1.0 µg/kg body weight/day (2018), 70 µg/day. A 50 g serving carries 0.672 µg, 0.96% of it, so it stays under 1% of the limit whatever the adult average. No more than about 5,200 g of chips a day would reach it, eaten alone (about 1,080 g at the highest single sample, 65 µg/kg).
You’d need about 46 servings a day, every day, of this food alone to use up what an average adult’s intake leaves under the limit.
Learn more
One serving carries 0.16 µg
How we got this
A serving a day adds 0.9% to what an average adult already takes in: a share of that intake, not of the limit. With that serving every day, an average adult would be at about 71% of the limit.
An average adult already takes in about 71% of the limit. One serving a day fits in the room left.
Counted from zero, with no allowance for what adults already take in from other food, 54,000 g a week would reach the limit.
Why this rating: Eating it daily comes to 350 g a week, which stays within the 16,000 g of room left before the limit.
The dataset’s rating: Nothing to watch: under the limit
A daily serving adds 0.91% to an average adult's cadmium intake (EFSA 2012 adult median, 1.77 µg/kg body weight/week; Canadian adults in 2007: 1.2-1.75), far from doubling it, so no cap.
Health Canada, Canadian Total Diet Study – Trace Elements (2005–2018 composites) · grade A
1 other measurement of this food, same verdict
You’d need about 74 servings a day, every day, of this food alone to use up what an average adult’s intake leaves under the limit.
Learn more
One serving carries 0.1 µg
How we got this
A serving a day adds 0.6% to what an average adult already takes in: a share of that intake, not of the limit. With that serving every day, an average adult would be at about 71% of the limit.
An average adult already takes in about 71% of the limit. One serving a day fits in the room left.
Counted from zero, with no allowance for what adults already take in from other food, 88,000 g a week would reach the limit.
Why this rating: Eating it daily comes to 350 g a week, which stays within the 26,000 g of room left before the limit.
The dataset’s rating: Nothing to watch: under the limit
A daily serving adds 0.56% to an average adult's cadmium intake (EFSA 2012 adult median, 1.77 µg/kg body weight/week; Canadian adults in 2007: 1.2-1.75), far from doubling it, so no cap.
US FDA, Total Diet Study FY2018–FY2020 Elements Report Supplement · grade A
You’d need more than 100 servings a day, every day, of this food alone to double the ochratoxin A an average adult already gets. No dose is known to be safe, so doubling is where we flag.
Learn more
A serving a day adds 0.2–0.9% to what an average adult already takes in. There is no limit to take a share of.
One serving carries 1.03 ng
How we got this
The dataset’s rating: Nothing to watch: doesn’t double average intake
No cap: no safe threshold is set for ochratoxin A; EFSA (2020) counts a margin of exposure of 10,000 on a benchmark dose lower limit (BMDL10) of 14.5 µg/kg body weight/day as low concern. A 50 g serving is 1.03 ng, 0.015 ng/kg body weight, and adds 0.2-0.9% to the adult mean (lower-bound means 1.66-3.84, upper-bound 3.47-6.03 ng/kg body weight/day). The highest sample, 0.591 ng/g, gives 29.6 ng, 0.42 ng/kg body weight: 11-25% of the lower-bound mean.
1 other measurement of this food, same verdict
You’d need about 35 servings a day, every day, of this food alone to double the ochratoxin A an average adult already gets. No dose is known to be safe, so doubling is where we flag.
Learn more
A serving a day adds 0.8–2.9% to what an average adult already takes in. There is no limit to take a share of.
One serving carries 3.36 ng
How we got this
The dataset’s rating: Nothing to watch: doesn’t double average intake
No cap: no safe threshold is set for ochratoxin A. A 50 g serving is 3.36 ng, 0.048 ng/kg body weight, 0.8-2.9% of the lower-bound adult mean (1.66-3.84 ng/kg body weight/day). The highest sample, 1.844 ng/g, gives 92 ng, 1.32 ng/kg body weight: 34-79% of that mean. An older source, not averaged with the newer row.
You’d need more than 100 servings a day, every day, of this food alone to double the lead an average adult already gets. No dose is known to be safe, so doubling is where we flag.
Learn more
A serving a day adds 0.3% to what an average adult already takes in. There is no limit to take a share of.
One serving carries 0.09 µg
How we got this
The dataset’s rating: Nothing to watch: doesn’t double average intake
No cap: a 50 g serving adds 0.26% to the average adult's lead intake of 35 µg/day (0.091 µg; EFSA 2012), far from doubling it. The 2016 Quebec City composite alone (8.323 ng/g) would give 0.416 µg, 1.19%. No safe threshold is set for lead.
Health Canada, Canadian Total Diet Study – Trace Elements (2005–2018 composites) · grade A
1 other measurement of this food, same verdict
You’d need more than 100 servings a day, every day, of this food alone to double the lead an average adult already gets. No dose is known to be safe, so doubling is where we flag.
Learn more
A serving a day adds 0–0.6% to what an average adult already takes in. There is no limit to take a share of.
One serving carries 0.2 µg (upper bound, at the reporting limit)
How we got this
The dataset’s rating: Nothing to watch: doesn’t double average intake
No cap on either bound: every sample was below detection, so the lower bound is 0; at the 4 ppb reporting limit a 50 g serving carries 0.2 µg, 0.57% of the average adult's 35 µg/day.
US FDA, Total Diet Study FY2018–FY2020 Elements Report Supplement · grade A
Worth knowing
No limit applies, so none is rated.
Sugar
0.4 g of sugar in a 50 g serving, natural and added together.
Learn more
Shown, not rated. The food tables we read give total sugar, and few give added sugar, so the site can’t yet tell sugar added in making a food from the sugar in fruit or milk.
Also checked (nothing to act on) · 1
Noted for context, or not measured in this food yet.
Context only, never scored: total arsenic. Inorganic arsenic was not measured in chips (no source found).
Better options
How we counted this
“Better” here always means better at something the row names: more of one nutrient, more nutrients per serving, or the goal you pick. It never means better in every way.
Every amount below is for the same weight, 50 g, the size of one serving of this food, so a swap compares like with like. A serving of another food can be bigger or smaller.
A food is listed only if it gives clearly more: at least a fifth more than this food, and at least 10% of the daily amount more.
More of what it’s good for
More magnesium
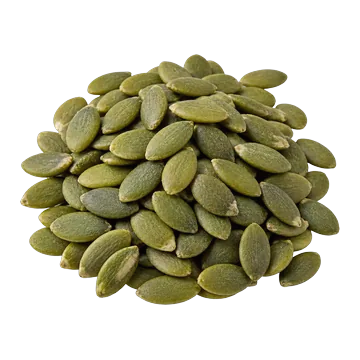 Pumpkin seeds250 mg in 50 g (this food: 42 mg)
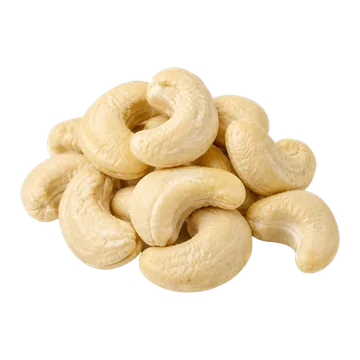 Cashews, raw125 mg in 50 g (this food: 42 mg)
Amounts as listed, not adjusted for how much gets in.
For vitamin E: Sunflower seeds, dry-roasted would lead, in the same 50 g, but is left out (Cadmium: go easy).
More nutrients per serving, counted together
The other snacks we’ve checked with more nutrients per serving than this one, counting at most 100 kcal. One score ranks them all, so the same few often lead.
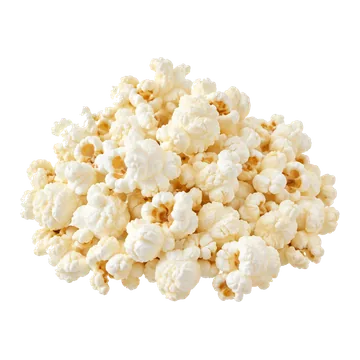 Popcorn, air-popped
- More fibre (7.25 g vs 2.7 g)
- Less vitamin E (0.15 mg vs 1.77 mg)
- Pumpkin seeds
- More magnesium (250 mg vs 42 mg)
- More niacin (7.29 mg vs 1.07 mg)
- More zinc (3.17 mg vs 0.69 mg)
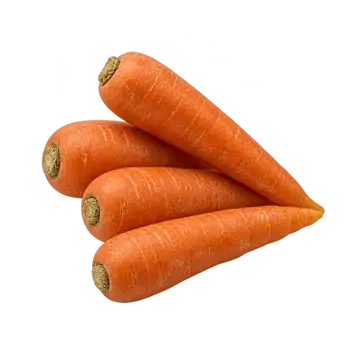 Carrots, rawMore vitamin A (418 µg vs 0 µg)
Where the calcium card measured that less calcium gets in than from milk, calcium counts for less; everything else is as listed.
Your goal
Your goal changes only this list, not what the food gives you or what to watch.
Losing weight: fewer calories, and more nutrients, protein and fibre for each calorie.
- Popcorn, air-popped
- More fibre (7.25 g vs 2.7 g)
- Less vitamin E (0.15 mg vs 1.77 mg)
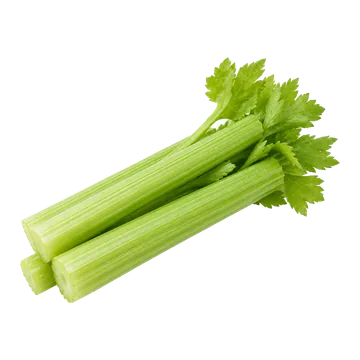 Celery, raw
- 7 kcal in 50 g (this food: 236)
- Less vitamin E (0.14 mg vs 1.77 mg)
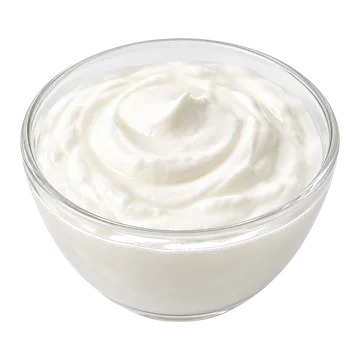 Greek yogurt, plain, nonfat
- 30 kcal in 50 g (this food: 236)
- Less vitamin E (0.01 mg vs 1.77 mg)
Building muscle: more protein and more calories, per 100 g.
- Pumpkin seeds29.9 g protein · 515 kcal per 100 g
- Cashews, raw17.4 g protein · 533 kcal per 100 g
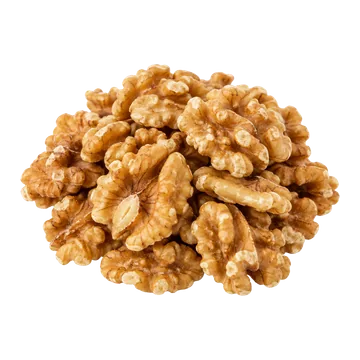 Walnuts, raw14.6 g protein · 679 kcal per 100 g
Why some foods aren’t suggested
Left out: Sunflower seeds, dry-roasted (Cadmium: go easy).
Bring a tracker export or describe your usual week. The same rules check all of it.
The numbers
Open every value
Name in the database: Tortilla and corn chips (fried, salted; category row)
How the serving was set: 50 g (Health Canada Table of Reference Amounts, row S.1: chips, pretzels, popcorn, includes coated versions, extruded snacks, grain and pulse-based snacks, pita chips and fruit-based snacks)
Listed nutrients, per 100 g
For each nutrient, the value this page uses is marked “used”. A row marked “second database” is another database’s figure for a matching food, kept so you can see how far databases disagree (they can differ in the samples analysed, lab methods and rounding). Its own cells are worked out from it, but none of the page’s words or scores are.
| Nutrient | Per serving | Per 100 calories | How | Source | Grade | |
|---|---|---|---|---|---|---|
| Omega-3: ALA | 0.231 g | 0.12 g | 0.05 g | listed used | US food database (USDA SR Legacy) #167558 | C |
| Calcium | 106 mg | 53 mg | 22.46 mg | listed used | US food database (USDA SR Legacy) #167558 | C |
| 103 mg | 51.5 mg | 21.82 mg | second database · not used | UK food tables (CoFID 2021) #17-644 | C | |
| 106 mg | 53 mg | 22.46 mg | copy of USDA · not used | Canadian Nutrient File 2026 #4127 | C | |
| Carbohydrate | 67.78 g | 33.89 g | 14.36 g | listed used | US food database (USDA SR Legacy) #167558 | C |
| Choline | 19.4 mg | 9.7 mg | 4.11 mg | listed used | US food database (USDA SR Legacy) #167558 | C |
| Energy | 472 kcal | 236 kcal | – | FDC Energy (kcal) used | US food database (USDA SR Legacy) | – |
| Omega-3: EPA + DHA | 0 g | 0 g | 0 g | listed used | US food database (USDA SR Legacy) #167558 | C |
| Fat | 20.68 g | 10.34 g | 4.38 g | listed used | US food database (USDA SR Legacy) #167558 | C |
| 27.4 g | 13.7 g | 5.81 g | second database · not used | UK food tables (CoFID 2021) #17-644 | C | |
| Cholesterol | 0 mg | 0 mg | 0 mg | listed used | US food database (USDA SR Legacy) #167558 | C |
| Fatty acids, total saturated | 2.811 g | 1.41 g | 0.6 g | listed used | US food database (USDA SR Legacy) #167558 | C |
| Fibre | 5.4 g | 2.7 g | 1.14 g | listed used | US food database (USDA SR Legacy) #167558 | C |
| 5.9 g | 2.95 g | 1.25 g | second database · not used | UK food tables (CoFID 2021) #17-644 | C | |
| Folate | 12 µg | 6 µg | 2.54 µg | listed used | US food database (USDA SR Legacy) #167558 | C |
| 10 µg | 5 µg | 2.12 µg | second database · not used | UK food tables (CoFID 2021) #17-644 | C | |
| Iron | 1.52 mg | 0.76 mg | 0.32 mg | listed used | US food database (USDA SR Legacy) #167558 | C |
| 1.5 mg | 0.75 mg | 0.32 mg | second database · not used | UK food tables (CoFID 2021) #17-644 | C | |
| Magnesium | 84 mg | 42 mg | 17.8 mg | listed used | US food database (USDA SR Legacy) #167558 | C |
| 78 mg | 39 mg | 16.53 mg | second database · not used | UK food tables (CoFID 2021) #17-644 | C | |
| Niacin (B3, niacin equivalents) | 2.14 mg | 1.07 mg | 0.45 mg | listed used | Canadian Nutrient File 2026 #4127 | C |
| Phosphorus | 225 mg | 112.5 mg | 47.67 mg | listed used | US food database (USDA SR Legacy) #167558 | C |
| 234 mg | 117 mg | 49.58 mg | second database · not used | UK food tables (CoFID 2021) #17-644 | C | |
| Potassium | 182 mg | 91 mg | 38.56 mg | listed used | US food database (USDA SR Legacy) #167558 | C |
| 285 mg | 142.5 mg | 60.38 mg | second database · not used | UK food tables (CoFID 2021) #17-644 | C | |
| Protein | 7.1 g | 3.55 g | 1.5 g | listed used | US food database (USDA SR Legacy) #167558 | C |
| 7.2 g | 3.6 g | 1.53 g | second database · not used | UK food tables (CoFID 2021) #17-644 | C | |
| Riboflavin (B2) | 0.07 mg | 0.04 mg | 0.01 mg | listed used | US food database (USDA SR Legacy) #167558 | C |
| 0.18 mg | 0.09 mg | 0.04 mg | second database · not used · 2.6× | UK food tables (CoFID 2021) #17-644 | C | |
| Selenium | 4.4 µg | 2.2 µg | 0.93 µg | listed used | US food database (USDA SR Legacy) #167558 | C |
| 5 µg | 2.5 µg | 1.06 µg | second database · not used | UK food tables (CoFID 2021) #17-644 | C | |
| Sodium | 328 mg | 164 mg | 69.49 mg | listed used | US food database (USDA SR Legacy) #167558 | C |
| 636 mg | 318 mg | 134.75 mg | second database · not used | UK food tables (CoFID 2021) #17-644 | C | |
| Sugars | 0.78 g | 0.39 g | 0.17 g | listed used | US food database (USDA SR Legacy) #167558 | C |
| 2.5 g | 1.25 g | 0.53 g | second database · not used · 3.2× | UK food tables (CoFID 2021) #17-644 | C | |
| Thiamin (B1) | 0.14 mg | 0.07 mg | 0.03 mg | listed used | US food database (USDA SR Legacy) #167558 | C |
| 0.11 mg | 0.06 mg | 0.02 mg | second database · not used | UK food tables (CoFID 2021) #17-644 | C | |
| Vitamin A | 0 µg | 0 µg | 0 µg | listed used | US food database (USDA SR Legacy) #167558 | C |
| Vitamin B12 | 0.36 µg | 0.18 µg | 0.08 µg | listed used | US food database (USDA SR Legacy) #167558 | C |
| 0 µg | 0 µg | 0 µg | second database · not used | UK food tables (CoFID 2021) #17-644 | C | |
| Vitamin B6 | 0.179 mg | 0.09 mg | 0.04 mg | listed used | US food database (USDA SR Legacy) #167558 | C |
| 0.15 mg | 0.08 mg | 0.03 mg | second database · not used | UK food tables (CoFID 2021) #17-644 | C | |
| Vitamin C | 0 mg | 0 mg | 0 mg | listed used | US food database (USDA SR Legacy) #167558 | C |
| Vitamin D | 0 µg | 0 µg | 0 µg | listed used | US food database (USDA SR Legacy) #167558 | C |
| 0 µg | 0 µg | 0 µg | second database · not used | UK food tables (CoFID 2021) #17-644 | C | |
| Vitamin E | 3.53 mg | 1.77 mg | 0.75 mg | listed used | US food database (USDA SR Legacy) #167558 | C |
| 7.11 mg | 3.56 mg | 1.51 mg | second database · not used · 2× | UK food tables (CoFID 2021) #17-644 | C | |
| Vitamin K1 | 20.9 µg | 10.45 µg | 4.43 µg | listed used | US food database (USDA SR Legacy) #167558 | C |
| Water | 2.64 g | 1.32 g | 0.56 g | listed used | US food database (USDA SR Legacy) #167558 | C |
| 1.3 g | 0.65 g | 0.28 g | second database · not used · 2× | UK food tables (CoFID 2021) #17-644 | C | |
| Zinc | 1.38 mg | 0.69 mg | 0.29 mg | listed used | US food database (USDA SR Legacy) #167558 | C |
| 1.2 mg | 0.6 mg | 0.25 mg | second database · not used | UK food tables (CoFID 2021) #17-644 | C |
| Nutrient | Per 100 g | Per serving | Per 100 calories | How | Source | Grade |
|---|---|---|---|---|---|---|
| Beta-carotene | 2 µg | 1 µg | 0.42 µg | listed used | US food database (USDA SR Legacy) #167558 | C |
| 141 µg | 70.5 µg | 29.87 µg | second database · not used · 70.5× | UK food tables (CoFID 2021) #17-644 | C | |
| Copper | 0.097 mg | 0.05 mg | 0.02 mg | listed used | US food database (USDA SR Legacy) #167558 | C |
| 0.1 mg | 0.05 mg | 0.02 mg | second database · not used | UK food tables (CoFID 2021) #17-644 | C | |
| Ash | 1.79 g | 0.9 g | 0.38 g | listed used | US food database (USDA SR Legacy) #167558 | C |
| Starch | 62.53 g | 31.27 g | 13.25 g | listed used | US food database (USDA SR Legacy) #167558 | C |
| Sucrose | 0.78 g | 0.39 g | 0.17 g | listed used | US food database (USDA SR Legacy) #167558 | C |
| Glucose | 0 g | 0 g | 0 g | listed used | US food database (USDA SR Legacy) #167558 | C |
| Fructose | 0 g | 0 g | 0 g | listed used | US food database (USDA SR Legacy) #167558 | C |
| Maltose | 0 g | 0 g | 0 g | listed used | US food database (USDA SR Legacy) #167558 | C |
| Alcohol, ethyl | 0 g | 0 g | 0 g | listed used | US food database (USDA SR Legacy) #167558 | C |
| Caffeine | 0 mg | 0 mg | 0 mg | listed used | US food database (USDA SR Legacy) #167558 | C |
| Theobromine | 0 mg | 0 mg | 0 mg | listed used | US food database (USDA SR Legacy) #167558 | C |
| Energy | 1,976 kj | 988 kj | 418.64 kj | listed used | US food database (USDA SR Legacy) #167558 | C |
| Galactose | 0 g | 0 g | 0 g | listed used | US food database (USDA SR Legacy) #167558 | C |
| Fluoride, F | 51.9 µg | 25.95 µg | 11 µg | listed used | US food database (USDA SR Legacy) #167558 | C |
| Vitamin A, IU | 4 iu | 2 iu | 0.85 iu | listed used | US food database (USDA SR Legacy) #167558 | C |
| Carotene, alpha | 0 µg | 0 µg | 0 µg | listed used | US food database (USDA SR Legacy) #167558 | C |
| Vitamin D (D2 + D3), International Units | 0 iu | 0 iu | 0 iu | listed used | US food database (USDA SR Legacy) #167558 | C |
| Cryptoxanthin, beta | 2 µg | 1 µg | 0.42 µg | listed used | US food database (USDA SR Legacy) #167558 | C |
| Lycopene | 0 µg | 0 µg | 0 µg | listed used | US food database (USDA SR Legacy) #167558 | C |
| Tocopherol, beta | 0.11 mg | 0.06 mg | 0.02 mg | listed used | US food database (USDA SR Legacy) #167558 | C |
| Tocopherol, gamma | 9.14 mg | 4.57 mg | 1.94 mg | listed used | US food database (USDA SR Legacy) #167558 | C |
| Tocopherol, delta | 0.36 mg | 0.18 mg | 0.08 mg | listed used | US food database (USDA SR Legacy) #167558 | C |
| Tocotrienol, alpha | 0.49 mg | 0.25 mg | 0.1 mg | listed used | US food database (USDA SR Legacy) #167558 | C |
| Tocotrienol, beta | 0.42 mg | 0.21 mg | 0.09 mg | listed used | US food database (USDA SR Legacy) #167558 | C |
| Tocotrienol, gamma | 1.15 mg | 0.58 mg | 0.24 mg | listed used | US food database (USDA SR Legacy) #167558 | C |
| Tocotrienol, delta | 0 mg | 0 mg | 0 mg | listed used | US food database (USDA SR Legacy) #167558 | C |
| Vitamin K (Dihydrophylloquinone) | 43.7 µg | 21.85 µg | 9.26 µg | listed used | US food database (USDA SR Legacy) #167558 | C |
| Folic acid | 0 µg | 0 µg | 0 µg | listed used | US food database (USDA SR Legacy) #167558 | C |
| Folate, food | 12 µg | 6 µg | 2.54 µg | listed used | US food database (USDA SR Legacy) #167558 | C |
| Folate, DFE | 12 µg | 6 µg | 2.54 µg | listed used | US food database (USDA SR Legacy) #167558 | C |
| Betaine | 0.4 mg | 0.2 mg | 0.08 mg | listed used | US food database (USDA SR Legacy) #167558 | C |
| Vitamin E, added | 0 mg | 0 mg | 0 mg | listed used | US food database (USDA SR Legacy) #167558 | C |
| Vitamin B-12, added | 0 µg | 0 µg | 0 µg | listed used | US food database (USDA SR Legacy) #167558 | C |
| Fatty acids, total trans | 0.812 g | 0.41 g | 0.17 g | listed used | US food database (USDA SR Legacy) #167558 | C |
| SFA 4:0 | 0 g | 0 g | 0 g | listed used | US food database (USDA SR Legacy) #167558 | C |
| SFA 6:0 | 0 g | 0 g | 0 g | listed used | US food database (USDA SR Legacy) #167558 | C |
| SFA 8:0 | 0.008 g | 0 g | 0 g | listed used | US food database (USDA SR Legacy) #167558 | C |
| SFA 10:0 | 0.01 g | 0.01 g | 0 g | listed used | US food database (USDA SR Legacy) #167558 | C |
| SFA 12:0 | 0.003 g | 0 g | 0 g | listed used | US food database (USDA SR Legacy) #167558 | C |
| SFA 14:0 | 0.015 g | 0.01 g | 0 g | listed used | US food database (USDA SR Legacy) #167558 | C |
| SFA 16:0 | 2.245 g | 1.12 g | 0.48 g | listed used | US food database (USDA SR Legacy) #167558 | C |
| SFA 18:0 | 0.376 g | 0.19 g | 0.08 g | listed used | US food database (USDA SR Legacy) #167558 | C |
| SFA 20:0 | 0.076 g | 0.04 g | 0.02 g | listed used | US food database (USDA SR Legacy) #167558 | C |
| MUFA 18:1 | 5.56 g | 2.78 g | 1.18 g | listed used | US food database (USDA SR Legacy) #167558 | C |
| PUFA 18:2 | 10.522 g | 5.26 g | 2.23 g | listed used | US food database (USDA SR Legacy) #167558 | C |
| PUFA 18:3 | 0.231 g | 0.12 g | 0.05 g | listed used | US food database (USDA SR Legacy) #167558 | C |
| PUFA 20:4 | 0.005 g | 0 g | 0 g | listed used | US food database (USDA SR Legacy) #167558 | C |
| PUFA 22:6 n-3 (DHA) | 0 g | 0 g | 0 g | listed used | US food database (USDA SR Legacy) #167558 | C |
| SFA 22:0 | 0.028 g | 0.01 g | 0.01 g | listed used | US food database (USDA SR Legacy) #167558 | C |
| MUFA 14:1 | 0 g | 0 g | 0 g | listed used | US food database (USDA SR Legacy) #167558 | C |
| MUFA 16:1 | 0.023 g | 0.01 g | 0 g | listed used | US food database (USDA SR Legacy) #167558 | C |
| PUFA 18:4 | 0.002 g | 0 g | 0 g | listed used | US food database (USDA SR Legacy) #167558 | C |
| MUFA 20:1 | 0.071 g | 0.04 g | 0.02 g | listed used | US food database (USDA SR Legacy) #167558 | C |
| PUFA 20:5 n-3 (EPA) | 0 g | 0 g | 0 g | listed used | US food database (USDA SR Legacy) #167558 | C |
| MUFA 22:1 | 0.002 g | 0 g | 0 g | listed used | US food database (USDA SR Legacy) #167558 | C |
| PUFA 22:5 n-3 (DPA) | 0 g | 0 g | 0 g | listed used | US food database (USDA SR Legacy) #167558 | C |
| Stigmasterol | 14 mg | 7 mg | 2.97 mg | listed used | US food database (USDA SR Legacy) #167558 | C |
| Campesterol | 24 mg | 12 mg | 5.08 mg | listed used | US food database (USDA SR Legacy) #167558 | C |
| Beta-sitosterol | 61 mg | 30.5 mg | 12.92 mg | listed used | US food database (USDA SR Legacy) #167558 | C |
| Fatty acids, total monounsaturated | 5.664 g | 2.83 g | 1.2 g | listed used | US food database (USDA SR Legacy) #167558 | C |
| Fatty acids, total polyunsaturated | 10.769 g | 5.38 g | 2.28 g | listed used | US food database (USDA SR Legacy) #167558 | C |
| SFA 15:0 | 0.003 g | 0 g | 0 g | listed used | US food database (USDA SR Legacy) #167558 | C |
| SFA 17:0 | 0.014 g | 0.01 g | 0 g | listed used | US food database (USDA SR Legacy) #167558 | C |
| SFA 24:0 | 0.033 g | 0.02 g | 0.01 g | listed used | US food database (USDA SR Legacy) #167558 | C |
| TFA 16:1 t | 0 g | 0 g | 0 g | listed used | US food database (USDA SR Legacy) #167558 | C |
| TFA 22:1 t | 0 g | 0 g | 0 g | listed used | US food database (USDA SR Legacy) #167558 | C |
| TFA 18:2 t not further defined | 0.098 g | 0.05 g | 0.02 g | listed used | US food database (USDA SR Legacy) #167558 | C |
| PUFA 18:2 i | 0.713 g | 0.36 g | 0.15 g | listed used | US food database (USDA SR Legacy) #167558 | C |
| PUFA 18:2 CLAs | 0.015 g | 0.01 g | 0 g | listed used | US food database (USDA SR Legacy) #167558 | C |
| MUFA 24:1 c | 0 g | 0 g | 0 g | listed used | US food database (USDA SR Legacy) #167558 | C |
| PUFA 20:2 n-6 c,c | 0.004 g | 0 g | 0 g | listed used | US food database (USDA SR Legacy) #167558 | C |
| MUFA 16:1 c | 0.023 g | 0.01 g | 0 g | listed used | US food database (USDA SR Legacy) #167558 | C |
| MUFA 18:1 c | 5.56 g | 2.78 g | 1.18 g | listed used | US food database (USDA SR Legacy) #167558 | C |
| PUFA 18:2 n-6 c,c | 9.695 g | 4.85 g | 2.05 g | listed used | US food database (USDA SR Legacy) #167558 | C |
| MUFA 22:1 c | 0.002 g | 0 g | 0 g | listed used | US food database (USDA SR Legacy) #167558 | C |
| PUFA 18:3 n-6 c,c,c | 0 g | 0 g | 0 g | listed used | US food database (USDA SR Legacy) #167558 | C |
| MUFA 17:1 | 0.008 g | 0 g | 0 g | listed used | US food database (USDA SR Legacy) #167558 | C |
| Fatty acids, total trans-monoenoic | 0 g | 0 g | 0 g | listed used | US food database (USDA SR Legacy) #167558 | C |
| Fatty acids, total trans-polyenoic | 0.812 g | 0.41 g | 0.17 g | listed used | US food database (USDA SR Legacy) #167558 | C |
| MUFA 15:1 | 0 g | 0 g | 0 g | listed used | US food database (USDA SR Legacy) #167558 | C |
| PUFA 18:3 n-3 c,c,c (ALA) | 0.23 g | 0.12 g | 0.05 g | listed used | US food database (USDA SR Legacy) #167558 | C |
| PUFA 20:3 n-3 | 0 g | 0 g | 0 g | listed used | US food database (USDA SR Legacy) #167558 | C |
| PUFA 20:3 n-6 | 0 g | 0 g | 0 g | listed used | US food database (USDA SR Legacy) #167558 | C |
| PUFA 18:3i | 0 g | 0 g | 0 g | listed used | US food database (USDA SR Legacy) #167558 | C |
| PUFA 22:4 | 0.003 g | 0 g | 0 g | listed used | US food database (USDA SR Legacy) #167558 | C |
| Lactose | 0 g | 0 g | 0 g | listed used | US food database (USDA SR Legacy) #167558 | C |
| 1 g | 0.5 g | 0.21 g | second database · not used | UK food tables (CoFID 2021) #17-644 | C | |
| Lutein + zeaxanthin | 5 µg | 2.5 µg | 1.06 µg | listed used | US food database (USDA SR Legacy) #167558 | C |
| Manganese | 0.388 mg | 0.19 mg | 0.08 mg | listed used | US food database (USDA SR Legacy) #167558 | C |
| 0.4 mg | 0.2 mg | 0.08 mg | second database · not used | UK food tables (CoFID 2021) #17-644 | C | |
| Niacin (B3, preformed) | 0.838 mg | 0.42 mg | 0.18 mg | listed used | US food database (USDA SR Legacy) #167558 | C |
| 0.5 mg | 0.25 mg | 0.11 mg | second database · not used | UK food tables (CoFID 2021) #17-644 | C | |
| Pantothenic acid (B5) | 0.297 mg | 0.15 mg | 0.06 mg | listed used | US food database (USDA SR Legacy) #167558 | C |
| 0.28 mg | 0.14 mg | 0.06 mg | second database · not used | UK food tables (CoFID 2021) #17-644 | C | |
| Retinol | 0 µg | 0 µg | 0 µg | listed used | US food database (USDA SR Legacy) #167558 | C |
| 0 µg | 0 µg | 0 µg | second database · not used | UK food tables (CoFID 2021) #17-644 | C |
Change the amount to rescale the first column. Nutrients a database doesn't list are missing, not zero.
Hazard rows as the dataset rates them
- Acrylamide · Nothing to watch: doesn’t double average intake · No cap: no safe threshold is set for acrylamide; EFSA (2015) counts a margin of exposure of 10,000 on a benchmark dose lower limit (BMDL10) of 0.17 mg/kg body weight/day as low concern. A 50 g serving is 8.6 µg (0.123 µg/kg body weight) and adds 14-31% to EFSA's adult mean intake (0.4-0.9 µg/kg body weight/day), under doubling. The serving alone has a margin of about 1380; the average adult's is 189-425, both far below 10,000. Based on three samples. · CFIA 2013–2015 · A
- Acrylamide · Nothing to watch: doesn’t double average intake · No cap: no safe threshold is set for acrylamide; EFSA (2015) counts a margin of exposure of 10,000 on a benchmark dose lower limit (BMDL10) of 0.17 mg/kg body weight/day as low concern. A 50 g serving is 12.8 µg (0.182 µg/kg body weight) and adds 20-46% to EFSA's adult mean intake (0.4-0.9 µg/kg body weight/day), under doubling. The serving alone has a margin of about 930; the average adult's is 189-425, both far below 10,000. · FDA 2015 · A
- Acrylamide · Nothing to watch: doesn’t double average intake · No cap: no safe threshold is set for acrylamide; EFSA (2015) counts a margin of exposure of 10,000 on a benchmark dose lower limit (BMDL10) of 0.17 mg/kg body weight/day as low concern. A 50 g serving is 7.9 µg (0.113 µg/kg body weight) and adds 13-28% to EFSA's adult mean intake (0.4-0.9 µg/kg body weight/day), under doubling. The serving alone has a margin of about 1500; the average adult's is 189-425, both far below 10,000. · FDA 2011 · A
- Aflatoxins · Worth knowing · Flagged: no safe threshold is set for aflatoxins (EFSA 2020, benchmark dose lower limit (BMDL10) 0.4 µg/kg body weight/day for aflatoxin B1; a margin of exposure of 10,000 counts as low concern). None of the 18 samples had any aflatoxin, so a serving adds 0 at the lower bound. The upper bound cannot be built because the survey publishes no detection limit, so this stays a flag, not a number. Adult averages are 0.22-0.49 ng/kg body weight/day (lower bound), 1.35-3.25 (upper). · CFIA 2018–2019 · A
- Aflatoxins · Worth knowing · Flagged: no safe threshold is set for aflatoxins. As an illustration only, if every serving carried the 0.8 ppb average of positive samples, 50 g would be 40 ng, 0.57 ng/kg body weight: 117-260% of the lower-bound adult mean (0.22-0.49) but 18-42% of the upper-bound mean (1.35-3.25 ng/kg body weight/day), with a margin of exposure of about 700 against the benchmark dose lower limit (BMDL10). The real category mean is lower (86% of corn products had no aflatoxin; the sub-category sample size is unpublished), so this is a flag, not a number. · CFIA targeted surveys: Aflatoxins 2010-2011 · B
- Arsenic, all forms · Context · Context only, never scored: total arsenic. Inorganic arsenic was not measured in chips (no source found). · Health Canada Total Diet Study, trace elements · A
- Cadmium · Nothing to watch: under the limit · A daily serving adds 0.91% to an average adult's cadmium intake (EFSA 2012 adult median, 1.77 µg/kg body weight/week; Canadian adults in 2007: 1.2-1.75), far from doubling it, so no cap. · Health Canada Total Diet Study, trace elements · A
- Cadmium · Nothing to watch: under the limit · A daily serving adds 0.56% to an average adult's cadmium intake (EFSA 2012 adult median, 1.77 µg/kg body weight/week; Canadian adults in 2007: 1.2-1.75), far from doubling it, so no cap. · US FDA Total Diet Study (2018–2020) · A
- Deoxynivalenol (vomitoxin) · Nothing to watch: under the limit · No cap: EFSA's group tolerable daily intake for deoxynivalenol is 1 µg/kg body weight/day (70 µg/day, 2017). A 50 g serving carries 0.278 µg, 0.40% of it, and adds 0.6-1.3% to the adult mean (0.3-0.7 µg/kg body weight/day = 21-49 µg/day). No more than about 12,600 g of chips a day would reach the limit, eaten alone; for a single sitting (acute reference dose 8 µg/kg body weight, 560 µg), about 100,000 g. · CFIA 2018–2019 · A
- Deoxynivalenol (vomitoxin) · Nothing to watch: under the limit · No cap: EFSA's group tolerable daily intake for deoxynivalenol is 1 µg/kg body weight/day (70 µg/day). A 50 g serving carries 4.78 µg, 6.8% of it, and adds 9.7-22.7% to the adult mean (21-49 µg/day), under doubling; about 733 g a day would reach the limit, eaten alone. One sample at 1,440 ng/g would put a serving at 72 µg, 103% of it: an observed extreme, not the basis of the rating. This 2010-11 row is 17 times the 2018-19 row; both are shown, neither is averaged, and the older one is flagged for recency. · CFIA 2010–2011 · A
- Fumonisins · Nothing to watch: under the limit · No cap: EFSA's group tolerable daily intake for fumonisins is 1.0 µg/kg body weight/day (2018), 70 µg/day. A 50 g serving carries 0.672 µg, 0.96% of it, so it stays under 1% of the limit whatever the adult average. No more than about 5,200 g of chips a day would reach it, eaten alone (about 1,080 g at the highest single sample, 65 µg/kg). · CFIA 2018–2019 · A
- Lead · Nothing to watch: doesn’t double average intake · No cap: a 50 g serving adds 0.26% to the average adult's lead intake of 35 µg/day (0.091 µg; EFSA 2012), far from doubling it. The 2016 Quebec City composite alone (8.323 ng/g) would give 0.416 µg, 1.19%. No safe threshold is set for lead. · Health Canada Total Diet Study, trace elements · A
- Lead · Nothing to watch: doesn’t double average intake · No cap on either bound: every sample was below detection, so the lower bound is 0; at the 4 ppb reporting limit a 50 g serving carries 0.2 µg, 0.57% of the average adult's 35 µg/day. · US FDA Total Diet Study (2018–2020) · A
- Nickel · Nothing to watch: under the limit · No cap: nickel is rated against EFSA's tolerable daily intake of 13 µg/kg body weight/day (2020). The average adult already takes in 22-26% of it, under half, so a food would have to reach the limit on its own to matter. A 50 g serving carries 9.67 µg, 1.06% of the limit, and adds 2.7-10.6% to the adult mean (90-361 µg/day); about 4,700 g of chips a day would reach it, eaten alone. · Health Canada Total Diet Study, trace elements · A
- Nickel · Nothing to watch: under the limit · No cap: nickel is rated against EFSA's tolerable daily intake of 13 µg/kg body weight/day (2020). The average adult already takes in 22-26% of it, under half, so a food would have to reach the limit on its own to matter. A 50 g serving carries 7.0 µg, 0.77% of the limit; about 6,500 g of chips a day would reach it, eaten alone. A second source, beside the Canadian row. · US FDA Total Diet Study (2018–2020) · A
- Ochratoxin A · Nothing to watch: doesn’t double average intake · No cap: no safe threshold is set for ochratoxin A; EFSA (2020) counts a margin of exposure of 10,000 on a benchmark dose lower limit (BMDL10) of 14.5 µg/kg body weight/day as low concern. A 50 g serving is 1.03 ng, 0.015 ng/kg body weight, and adds 0.2-0.9% to the adult mean (lower-bound means 1.66-3.84, upper-bound 3.47-6.03 ng/kg body weight/day). The highest sample, 0.591 ng/g, gives 29.6 ng, 0.42 ng/kg body weight: 11-25% of the lower-bound mean. · CFIA ochratoxin A survey (2012–2022) · A
- Ochratoxin A · Nothing to watch: doesn’t double average intake · No cap: no safe threshold is set for ochratoxin A. A 50 g serving is 3.36 ng, 0.048 ng/kg body weight, 0.8-2.9% of the lower-bound adult mean (1.66-3.84 ng/kg body weight/day). The highest sample, 1.844 ng/g, gives 92 ng, 1.32 ng/kg body weight: 34-79% of that mean. An older source, not averaged with the newer row. · CFIA 2010–2011 · A
Oxalate, phytate and gut-tolerance measurements
- fodmap fructan: 0.03 +/- 0.06 g/100 g of sample dry matter, n = 2: white maize flour (an ingredient, not nixtamalised, not a chip); the paper reports fructan and galactooligosaccharides together g/100 g dry matter · dry matter, ingredient flour · raw white maize flour (Pukanic Mill, Croatia) · grade B · Rados 2022
- fodmap fructan: not detected (ND) in corn flakes: fructan ND on dry-weight, fresh-weight and per-portion bases (the paper prints ND, no limit of detection in the table text read) g/100 g fresh weight · fresh weight, as sold · corn flakes (dry breakfast cereal, Slovenian grocery stores, 2022-2023) · grade B · Ferjancic 2024
Sources
- CFIA, FSAP Targeted Survey – Acrylamide 2013–2015
cfia-acrylamide-2013-2015· dataset · Open Government Licence – Canada 2.0 - CFIA targeted surveys: Aflatoxins 2010-2011; Aflatoxins in selected corn products, nuts, nut products... 2012-2013; Aflatoxins in chocolate, cocoa powder, grain-based foods, nuts and nut products, spices and wine 2014-2015
cfia-aflatoxins-surveys· page · Government of Canada terms (not confirmed as OGL; no open-data CSV found) - CFIA, Multi-Mycotoxins in Corn Products, Crackers, Other Grain Products, Pasta and Gluten-Free Products, 2018–2019
cfia-multimyco-2018-2019· dataset · Open Government Licence – Canada 2.0 - CFIA, Food Safety Action Plan Targeted Survey - Ochratoxin A in Selected Foods, 2012-2018 and 2019-2022
cfia-ota-2012-2022· dataset · Open Government Licence - Canada 2.0 (as for the other CFIA datasets; not checked on this page) - CFIA, Food Safety Action Plan Targeted Survey - Ochratoxin A and Deoxynivalenol in Selected Foods - 2010-2011 (open data, datastore resource b87d36bc-a568-4dc5-8391-9d8afdbf6048)
cfia-ota-don-2010-2011· dataset · Open Government Licence - Canada 2.0 - Health Canada, Canadian Nutrient File 2026 (14th edition)
cnf-2026· dataset · Open Government Licence – Canada 2.0 - Public Health England, Composition of Foods Integrated Dataset (CoFID) 2021
cofid-2021· dataset · Open Government Licence v3.0 - US FDA, Survey Data on Acrylamide in Food: Individual Food Products, data from 2011 (xlsx media/130926)
fda-acrylamide-2011· dataset · US Government work (public domain) - US FDA, Survey Data on Acrylamide in Food: Individual Food Products, data from 2015 (xlsx media/130927; page content current as of 2024-03-05)
fda-acrylamide-2015· dataset · US Government work (public domain) - US FDA, Total Diet Study FY2018–FY2020 Elements Report Supplement
fda-tds-fy2018-2020· dataset · US government work (17 USC 105), public domain - USDA FoodData Central, SR Legacy, 2018-04
fdc-sr-legacy-2018-04· dataset · CC0 1.0 (public domain) - Ferjancic B et al. 2024, Fructan content in most commonly consumed Slovenian foods, Front Nutr (PMC11327153)
ferjancic2024· full text read · CC BY 4.0 - Health Canada, Canadian Total Diet Study – Trace Elements (2005–2018 composites)
hc-tds-trace-elements· dataset · Open Government Licence – Canada 2.0 - Rados K, Sukelj Mustac N, Varga K, Drakula S, Voucko B, Curic D, Novotni D. Development of high-fibre and low-FODMAP crackers. Foods 2022;11(17):2577 · doi:10.3390/foods11172577 · PMID 36076763
rados2022· full text read · CC BY (MDPI)
Body map 2026-10-25.1: each nutrient’s job comes from an agency fact sheet, linked beside it under Good for.
The plain words: “a lot” means one serving (100 g when the food has no serving size) gives at least 20% of the daily amount (the reference intake), “some” at least 10%, “a little” at least 2% (the cut-offs are ours, one set for every page: 20% and 10% are borrowed from the US labelling terms “high” and “good source” and applied to Health Canada’s daily amount, whereas Health Canada’s own shopper rule says 15%; provisional: they may change in a later method version). The daily amount is Health Canada’s Dietary Reference Intake for adults 19–30; where men and women need different amounts we use the higher one (protein: 56 g for men, 46 g for women). The percentage printed under each nutrient is the printed amount as a share of that daily amount, rounded to the nearest whole number, and the word is read from that percentage, so the amount, the percentage and the word always agree. Calcium with a measured absorption is scaled by how well it gets in compared with milk.
The scale: “Nothing to watch” means a serving a day stays under the limit at ordinary amounts; “Go easy” means a serving a day can push past the limit for adults who already take in the most, or fewer than 2 servings reach it; “Limit it” means once a week or less. The dataset’s own rating is under “How we got this”. Provisional: the scale may change in a later method version.
Measured absorption under Good for: grade-A studies in adults that tested this preparation of this food, as a share of the listed amount (the share digested, for protein), quoted once each source has passed our evidence check; animal studies and other variants stay in the table above. Provisional: this screen may change in a later method version.