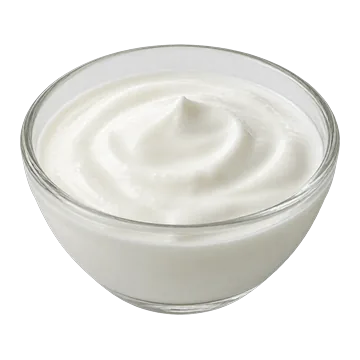
Plain yogurt, whole milk
Checked by us One serving: 115 g (about ½ cup) · 89 kcal
Lots of riboflavin.
Nothing to watch for most people.
Worth knowing for some people: dairy and ciprofloxacin.
Good for
How we counted this
What one serving (115 g) gives you.
Your body needs enough of each of these. Past enough, more doesn’t help. Amounts are what the food databases list, not what your body absorbs, unless a row says it was measured.
The words: “A lot” means one serving gives 20% or more of Health Canada’s daily amount, “Some” 10% to 19%, “A little” 2% to 9%, “Almost none” under 2%. Strongest word first; within a word, protein and fibre lead, then the biggest share. ?
A milligram (mg) is a thousandth of a gram, and a microgram (µg) a thousandth of a milligram: 1,000 µg make 1 mg.
- A lot
Riboflavin (B2)
Your cells use it to make energy and handle fats. It also helps turn tryptophan into niacin and activate vitamin B6.
Learn more
0.28 mg in one serving: 22% of the 1.3 mg a day men need, 25% of the 1.1 mg women need. The word follows the smaller share, which is the share of the higher amount. ?
Source: How much of it gets in hasn’t been measured for this food yet. NIH Office of Dietary Supplements, riboflavin fact sheet for health professionals
21 more nutrients below “a lot”
- Some
Vitamin B12
Your body needs it to make red blood cells and keep nerves working.
Learn more
0.43 µg in one serving: 18% of the 2.4 µg a day.
Source: How much of it gets in hasn’t been measured for this food yet. NIH Office of Dietary Supplements, vitamin B12 fact sheet for health professionals
- Some
Calcium
Builds your bones and teeth.
Learn more
146 mg in one serving: 15% of the 1,000 mg a day.
Listed amount only. 3 absorption studies of this nutrient are on file for this food, but none is quoted yet. Each one is in The numbers, with the reason. See the studies
Source: NIH Office of Dietary Supplements, calcium fact sheet for health professionals
- A little
Niacin (B3, niacin equivalents)
More than 400 of your enzymes need it to work.
Learn more
1.31 mg in one serving: 8% of the 16 mg a day men need, 9% of the 14 mg women need. The word follows the smaller share, which is the share of the higher amount. ?
Source: How much of it gets in hasn’t been measured for this food yet. NIH Office of Dietary Supplements, niacin fact sheet for health professionals
- A little
Protein
Your muscles, and every other tissue, are built and repaired from it.
Learn more
4.4 g in one serving: 8% of the 56 g a day men need, 10% of the 46 g women need. The word follows the smaller share, which is the share of the higher amount. ?
Listed amount only. 1 absorption study of this nutrient is on file for this food, but none is quoted yet. Each one is in The numbers, with the reason. See the studies
- A little
Potassium
Your nerves, muscles and kidneys need it to work.
Learn more
189 mg in one serving: 6% of the 3,400 mg a day men need, 7% of the 2,600 mg women need. The word follows the smaller share, which is the share of the higher amount. ?
Source: How much of it gets in hasn’t been measured for this food yet. NIH Office of Dietary Supplements, potassium fact sheet for health professionals
- A little
Thiamin (B1)
Your cells use it to get energy from food, and so to grow and work.
Learn more
0.06 mg in one serving: 5% of the 1.2 mg a day men need, 5% of the 1.1 mg women need. The word follows the smaller share, which is the share of the higher amount. ?
Source: How much of it gets in hasn’t been measured for this food yet. NIH Office of Dietary Supplements, thiamin fact sheet for health professionals
- A little
Selenium
Your thyroid uses it to make its hormones.
Learn more
2.53 µg in one serving: 5% of the 55 µg a day.
Source: How much of it gets in hasn’t been measured for this food yet. NIH Office of Dietary Supplements, selenium fact sheet for health professionals
- A little
Zinc
Your immune system and healing wounds depend on it.
Learn more
0.49 mg in one serving: 4% of the 11 mg a day men need, 6% of the 8 mg women need. The word follows the smaller share, which is the share of the higher amount. ?
Source: How much of it gets in hasn’t been measured for this food yet. NIH Office of Dietary Supplements, zinc fact sheet for health professionals
- A little
Vitamin B6
Helps you use protein, and your brain needs it to make its chemical messengers.
Learn more
0.05 mg in one serving: 4% of the 1.3 mg a day.
Source: How much of it gets in hasn’t been measured for this food yet. NIH Office of Dietary Supplements, vitamin B6 fact sheet for health professionals
- A little
Vitamin A
Your eyes need it to see in dim light.
Learn more
Getting enough matters; more than enough doesn’t sharpen your sight.
31.1 µg in one serving: 3% of the 900 µg a day men need, 4% of the 700 µg women need. The word follows the smaller share, which is the share of the higher amount. ?
Source: How much of it gets in hasn’t been measured for this food yet. NIH Office of Dietary Supplements, vitamin A fact sheet for health professionals
- A little
Magnesium
Your muscles and nerves need it to work.
Learn more
13.2 mg in one serving: 3% of the 400 mg a day men need, 4% of the 310 mg women need. The word follows the smaller share, which is the share of the higher amount. ?
Source: How much of it gets in hasn’t been measured for this food yet. NIH Office of Dietary Supplements, magnesium fact sheet for health professionals
- A little
Choline
Your cells need it for their membranes, and to make acetylcholine, a messenger for memory, mood and muscle control.
Learn more
17.5 mg in one serving: 3% of the 550 mg a day men need, 4% of the 425 mg women need. The word follows the smaller share, which is the share of the higher amount. ?
Source: How much of it gets in hasn’t been measured for this food yet. NIH Office of Dietary Supplements, choline fact sheet for health professionals
- A little
Folate
Your body needs it to make DNA and to divide new cells.
Learn more
8.05 µg in one serving: 2% of the 400 µg a day.
Source: How much of it gets in hasn’t been measured for this food yet. NIH Office of Dietary Supplements, folate fact sheet for health professionals
- A little
Omega-3: ALA
The one omega-3 your body can’t make: it must come from food. Your cells build it into their membranes and burn it for energy.
Learn more
31.1 mg in one serving: 2% of the 1,600 mg a day men need, 3% of the 1,100 mg women need. The word follows the smaller share, which is the share of the higher amount. ?
Source: How much of it gets in hasn’t been measured for this food yet. NIH Office of Dietary Supplements, omega-3 fatty acids fact sheet for health professionals
- Almost none
Vitamin C
Your body makes collagen with it, which wounds need to heal. It also helps you absorb iron from plants.
Learn more
0.58 mg in one serving: 1% of the 90 mg a day men need, 1% of the 75 mg women need. The word follows the smaller share, which is the share of the higher amount. ?
Source: How much of it gets in hasn’t been measured for this food yet. NIH Office of Dietary Supplements, vitamin C fact sheet for health professionals
- Almost none
Vitamin E
Shields the fats in your cells from damage; your immune system uses it too.
Learn more
0.07 mg in one serving: under 1% of the 15 mg a day.
Source: How much of it gets in hasn’t been measured for this food yet. NIH Office of Dietary Supplements, vitamin E fact sheet for health professionals
- Almost none
Vitamin K1
Your blood needs it to clot.
Learn more
0.23 µg in one serving: under 1% of the 120 µg a day men need, under 1% of the 90 µg women need. The word follows the smaller share, which is the share of the higher amount. ?
Source: How much of it gets in hasn’t been measured for this food yet. NIH Office of Dietary Supplements, vitamin K fact sheet for health professionals
- Almost none
Omega-3: EPA + DHA
Long-chain omega-3s, built into your cell membranes. DHA is concentrated in your brain and retinas.
Learn more
0 mg in one serving: under 1% of the 250 mg a day.
Health Canada sets no daily amount for these fats, so the daily figure here is the European Food Safety Authority’s.
Source: How much of it gets in hasn’t been measured for this food yet. NIH Office of Dietary Supplements, omega-3 fatty acids fact sheet for health professionals
- Almost none
Fibre
Keeps your gut moving.
Learn more
0 g in one serving: under 1% of the 38 g a day men need, under 1% of the 25 g women need. The word follows the smaller share, which is the share of the higher amount. ?
Source: How much of it gets in hasn’t been measured for this food yet. Institute of Medicine 2005, Dietary Reference Intakes for Energy, Carbohydrate, Fiber, Fat, Fatty Acids, Cholesterol, Protein, and Amino Acids
- Almost none
Iron
Carries oxygen in your blood.
Learn more
0 mg in one serving: under 1% of the 8 mg a day men need, under 1% of the 18 mg women need. The word follows the smaller share, which is the share of the higher amount. ?
Source: How much of it gets in hasn’t been measured for this food yet. NIH Office of Dietary Supplements, iron fact sheet for health professionals
- Almost none
Vitamin D
Your body needs it to absorb calcium and keep your bones hard.
Learn more
Your skin also makes it in sunlight, so food is only one of its sources.
0 µg in one serving: under 1% of the 15 µg a day.
Source: How much of it gets in hasn’t been measured for this food yet. NIH Office of Dietary Supplements, vitamin D fact sheet for health professionals
Watch out
How we counted this
Checked for histamine, cadmium and lead: fine at normal amounts.
Histamine
Nothing to watchYou’d need more than 100 servings in one meal of this food alone to reach the limit.
Learn more
One serving carries 0.35 mg
How we got this
16,000 g in one meal reaches the limit
The dataset’s rating: Nothing to watch: under the limit
No cap for healthy adults: EFSA's no-effect level is 50 mg of histamine per meal. The highest of 16 cow's-milk yogurts measured 3.05 mg/kg (14 had none detected), so a 115 g serving carries at most 0.35 mg, 0.7% of it. Sheep's-milk yogurts in the same study reached 17.16 mg/kg (1.97 mg per serving, 3.9%). EFSA's level for people with histamine intolerance is 'below detectable limits'.
Cadmium
Nothing to watchYou’d need more than 100 servings a day, every day, of this food alone to use up what an average adult’s intake leaves under the limit.
Learn more
One serving carries 0.03 µg
How we got this
A serving a day adds 0.2% to what an average adult already takes in: a share of that intake, not of the limit. With that serving every day, an average adult would be at about 71% of the limit.
An average adult already takes in about 71% of the limit. One serving a day fits in the room left.
Counted from zero, with no allowance for what adults already take in from other food, 780,000 g a week would reach the limit.
Why this rating: Eating it daily comes to 805 g a week, which stays within the 230,000 g of room left before the limit.
The dataset’s rating: Nothing to watch: under the limit
A daily serving adds 0.15% to an average adult's cadmium intake (EFSA 2012 adult median, 1.77 µg/kg body weight/week; Canadian adults in 2007: 1.2-1.75), far from doubling it, so no cap.
Health Canada, Canadian Total Diet Study – Trace Elements (2005–2018 composites) · grade A
Lead
Nothing to watchYou’d need more than 100 servings a day, every day, of this food alone to double the lead an average adult already gets. No dose is known to be safe, so doubling is where we flag.
Learn more
A serving a day adds 0.2–0.3% to what an average adult already takes in. There is no limit to take a share of.
One serving carries 0.08 µg
How we got this
The dataset’s rating: Nothing to watch: doesn’t double average intake
Lower bound 0.697, upper bound 0.826 µg/kg (2 of 17 composites non-detect, detection limits 0.39 and 1.8, counted as 0 in the lower bound). A daily serving adds 0.23-0.27% to EFSA's average adult intake (35 µg/day), so no cap. 2016-18 mean 0.494 (n 3). FDA Total Diet Study lowfat vanilla and lowfat fruit-flavored yogurt: 0 of 3 detects each, reporting limit 4 µg/kg (an upper bound at that limit would be 0.46 µg per serving, 1.3%).
Health Canada, Canadian Total Diet Study – Trace Elements (2005–2018 composites) · grade A
For some people
Worded as the label puts it: the ciprofloxacin label names yogurt; it is not to be taken with dairy alone, but may be taken with a meal that contains it.
Worth knowing
No limit applies, so none is rated.
Sugar
5.4 g of sugar in a 115 g serving, natural and added together.
Learn more
Shown, not rated. The food tables we read give total sugar, and few give added sugar, so the site can’t yet tell sugar added in making a food from the sugar in fruit or milk.
Also measured in it
Figures from the dataset. None has a limit to be rated against, so none is a verdict.
Lactose: 2.3–4.7 g per 100 g, so about 2.65–5.41 g in a 115 g serving. · Kenjeric 2016, PubMed 7076958, US food database (USDA Foundation Foods), Canadian Nutrient File 2026, UK food tables (CoFID 2021) · grade A, B
Tyramine: 1.9 mg per kg fresh weight, so about 0.22 mg in a 115 g serving. (mean 1.9 · max 5.2 · 29% below the detection limit · n 7) · EFSA 2011 · grade B
For scale, EFSA found no reported ill effects at 6 mg of tyramine in a meal for people on the older MAO-inhibitor antidepressants, 50 mg for those on the newer ones and 600 mg for healthy people not taking them, based on limited data. EFSA 2011
Better options
How we counted this
“Better” here always means better at something the row names: more of one nutrient, more nutrients per serving, or the goal you pick. It never means better in every way.
Every amount below is for the same weight, 115 g, the size of one serving of this food, so a swap compares like with like. A serving of another food can be bigger or smaller.
A food is listed only if it gives clearly more: at least a fifth more than this food, and at least 10% of the daily amount more.
More of what it’s good for
More riboflavin
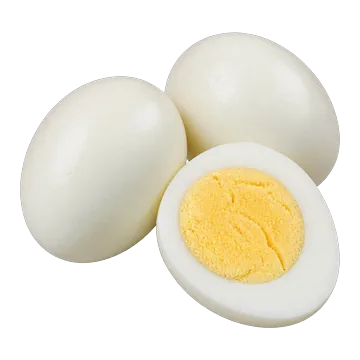 Eggs, hard-boiled0.59 mg in 115 g (this food: 0.28 mg)
Amounts as listed, not adjusted for how much gets in.
More nutrients per serving, counted together
The other dairy foods, breakfast foods or snacks we’ve checked with more nutrients per serving than this one, counting at most 100 kcal. One score ranks them all, so the same few often lead.
- Eggs, hard-boiled
- More selenium (35.4 µg vs 2.53 µg)
- More choline (338 mg vs 17.5 mg)
- More vitamin B12 (1.28 µg vs 0.43 µg)
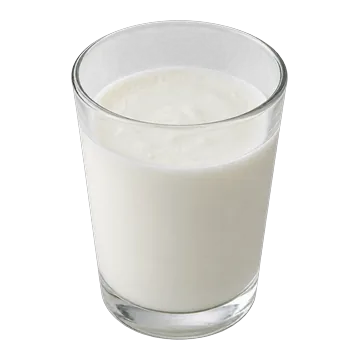 Kefir, low-fatMore vitamin A (197 µg vs 31.1 µg)
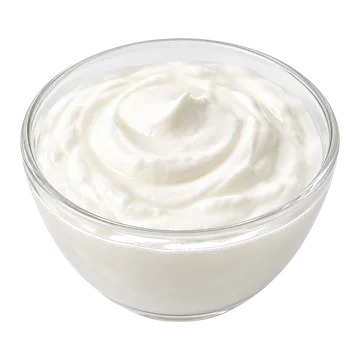 Greek yogurt, plain, nonfat
- More vitamin B12 (0.86 µg vs 0.43 µg)
- More selenium (11.2 µg vs 2.53 µg)
- More protein (11.7 g vs 4.4 g)
Where the calcium card measured that less calcium gets in than from milk, calcium counts for less; everything else is as listed.
Your goal
Your goal changes only this list, not what the food gives you or what to watch.
Losing weight: fewer calories, and more nutrients, protein and fibre for each calorie.
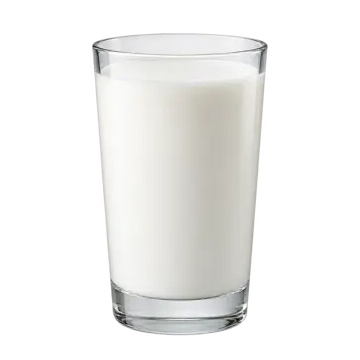 Skim milk39 kcal in 115 g (this food: 89)
- Greek yogurt, plain, nonfat
- 68 kcal in 115 g (this food: 89)
- More vitamin B12 (0.86 µg vs 0.43 µg)
- More selenium (11.2 µg vs 2.53 µg)
- More protein (11.7 g vs 4.4 g)
- Kefir, low-fat
- 49 kcal in 115 g (this food: 89)
- More vitamin A (197 µg vs 31.1 µg)
Building muscle: more protein and more calories, per 100 g.
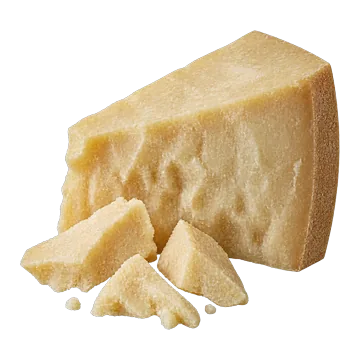 Parmesan35.8 g protein · 392 kcal per 100 g
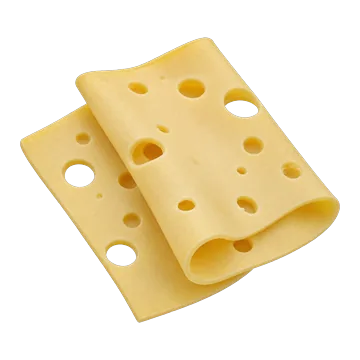 Swiss cheese27 g protein · 393 kcal per 100 g
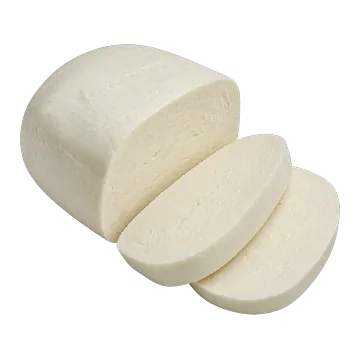 Mozzarella, part-skim23.7 g protein · 298 kcal per 100 g
Why some foods aren’t suggested
Left out: Almonds, dry-roasted (Aflatoxins: go easy · portions too different to compare by weight).
Bring a tracker export or describe your usual week. The same rules check all of it.
The numbers
Open every value
Name in the database: Yogurt, plain, whole milk
How the serving was set: 115 g (Health Canada D.15, yogurt)
Listed nutrients, per 100 g
For each nutrient, the value this page uses is marked “used”. A row marked “second database” is another database’s figure for a matching food, kept so you can see how far databases disagree (they can differ in the samples analysed, lab methods and rounding). Its own cells are worked out from it, but none of the page’s words or scores are.
| Nutrient | Per serving | Per 100 calories | How | Source | Grade | |
|---|---|---|---|---|---|---|
| Omega-3: ALA | 0.027 g | 0.03 g | 0.03 g | from SR Legacy used | US food database (USDA SR Legacy) #171284 | C |
| Calcium | 126.8 mg | 145.82 mg | 164 mg | listed used | US food database (USDA Foundation Foods) #2259793 | C |
| 200 mg | 230 mg | 258.67 mg | second database · not used | UK food tables (CoFID 2021) #12-184 | C | |
| 147 mg | 169.05 mg | 190.12 mg | second database · not used | Canadian Nutrient File 2026 #6961 | C | |
| Carbohydrate | 5.575 g | 6.41 g | 7.21 g | listed used | US food database (USDA Foundation Foods) #2259793 | C |
| Choline | 15.2 mg | 17.48 mg | 19.66 mg | from SR Legacy used | US food database (USDA SR Legacy) #171284 | C |
| Energy | 77.319 kcal | 88.92 kcal | – | FDC Energy (Atwater Specific Factors) used | US food database (USDA Foundation Foods) | – |
| 61 kcal | 70.15 kcal | – | from SR Legacy · not used | US food database (USDA SR Legacy) #171284 | C | |
| Omega-3: EPA + DHA | 0 g | 0 g | 0 g | from SR Legacy used | US food database (USDA SR Legacy) #171284 | C |
| Fat | 4.484 g | 5.16 g | 5.8 g | listed used | US food database (USDA Foundation Foods) #2259793 | C |
| 3 g | 3.45 g | 3.88 g | second database · not used | UK food tables (CoFID 2021) #12-184 | C | |
| Cholesterol | 14.17 mg | 16.3 mg | 18.33 mg | listed used | US food database (USDA Foundation Foods) #2259793 | C |
| Fatty acids, total saturated | 2.316 g | 2.66 g | 3 g | listed used | US food database (USDA Foundation Foods) #2259793 | C |
| Fibre | 0 g | 0 g | 0 g | from SR Legacy used | US food database (USDA SR Legacy) #171284 | C |
| 0 g | 0 g | 0 g | second database · not used | UK food tables (CoFID 2021) #12-184 | C | |
| Folate | 7 µg | 8.05 µg | 9.05 µg | from SR Legacy used | US food database (USDA SR Legacy) #171284 | C |
| 18 µg | 20.7 µg | 23.28 µg | second database · not used · 2.6× | UK food tables (CoFID 2021) #12-184 | C | |
| Iron | 0 mg | 0 mg | 0 mg | listed used | US food database (USDA Foundation Foods) #2259793 | C |
| 0.1 mg | 0.12 mg | 0.13 mg | second database · not used | UK food tables (CoFID 2021) #12-184 | C | |
| Magnesium | 11.45 mg | 13.17 mg | 14.81 mg | listed used | US food database (USDA Foundation Foods) #2259793 | C |
| 19 mg | 21.85 mg | 24.57 mg | second database · not used | UK food tables (CoFID 2021) #12-184 | C | |
| Niacin (B3, niacin equivalents) | 1.142 mg | 1.31 mg | 1.48 mg | listed used | Canadian Nutrient File 2026 #6961 | C |
| Phosphorus | 101.2 mg | 116.38 mg | 130.89 mg | listed used | US food database (USDA Foundation Foods) #2259793 | C |
| 170 mg | 195.5 mg | 219.87 mg | second database · not used | UK food tables (CoFID 2021) #12-184 | C | |
| Potassium | 164.1 mg | 188.72 mg | 212.24 mg | listed used | US food database (USDA Foundation Foods) #2259793 | C |
| 280 mg | 322 mg | 362.14 mg | second database · not used | UK food tables (CoFID 2021) #12-184 | C | |
| Protein | 3.824 g | 4.4 g | 4.95 g | listed used | US food database (USDA Foundation Foods) #2259793 | C |
| 5.7 g | 6.56 g | 7.37 g | second database · not used | UK food tables (CoFID 2021) #12-184 | C | |
| Riboflavin (B2) | 0.243 mg | 0.28 mg | 0.31 mg | listed used | US food database (USDA Foundation Foods) #2259793 | C |
| 0.27 mg | 0.31 mg | 0.35 mg | second database · not used | UK food tables (CoFID 2021) #12-184 | C | |
| Selenium | 2.2 µg | 2.53 µg | 2.85 µg | from SR Legacy used | US food database (USDA SR Legacy) #171284 | C |
| 2 µg | 2.3 µg | 2.59 µg | second database · not used | UK food tables (CoFID 2021) #12-184 | C | |
| Sodium | 41.78 mg | 48.05 mg | 54.04 mg | listed used | US food database (USDA Foundation Foods) #2259793 | C |
| 80 mg | 92 mg | 103.47 mg | second database · not used | UK food tables (CoFID 2021) #12-184 | C | |
| Sugars | 4.66 g | 5.36 g | 6.03 g | from SR Legacy used | US food database (USDA SR Legacy) #171284 | C |
| 7.8 g | 8.97 g | 10.09 g | second database · not used | UK food tables (CoFID 2021) #12-184 | C | |
| Thiamin (B1) | 0.055 mg | 0.06 mg | 0.07 mg | listed used | US food database (USDA Foundation Foods) #2259793 | C |
| 0.06 mg | 0.07 mg | 0.08 mg | second database · not used | UK food tables (CoFID 2021) #12-184 | C | |
| Vitamin A | 27 µg | 31.05 µg | 34.92 µg | from SR Legacy used | US food database (USDA SR Legacy) #171284 | C |
| Vitamin B12 | 0.37 µg | 0.43 µg | 0.48 µg | from SR Legacy used | US food database (USDA SR Legacy) #171284 | C |
| 0.2 µg | 0.23 µg | 0.26 µg | second database · not used | UK food tables (CoFID 2021) #12-184 | C | |
| Vitamin B6 | 0.045 mg | 0.05 mg | 0.06 mg | listed used | US food database (USDA Foundation Foods) #2259793 | C |
| 0.1 mg | 0.12 mg | 0.13 mg | second database · not used · 2.2× | UK food tables (CoFID 2021) #12-184 | C | |
| Vitamin C | 0.5 mg | 0.58 mg | 0.65 mg | from SR Legacy used | US food database (USDA SR Legacy) #171284 | C |
| 1 mg | 1.15 mg | 1.29 mg | second database · not used · 2× | UK food tables (CoFID 2021) #12-184 | C | |
| Vitamin D | 0 µg | 0 µg | 0 µg | listed used | Canadian Nutrient File 2026 #6961 | C |
| 0 µg | 0 µg | 0 µg | second database · not used | UK food tables (CoFID 2021) #12-184 | C | |
| 0.778 µg | 0.89 µg | 1.01 µg | second database · not used | US food database (USDA Foundation Foods) #2259793 | C | |
| Vitamin E | 0.06 mg | 0.07 mg | 0.08 mg | from SR Legacy used | US food database (USDA SR Legacy) #171284 | C |
| 0.05 mg | 0.06 mg | 0.06 mg | second database · not used | UK food tables (CoFID 2021) #12-184 | C | |
| Vitamin K1 | 0.2 µg | 0.23 µg | 0.26 µg | listed used | US food database (USDA Foundation Foods) #2259793 | C |
| Water | 85.27 g | 98.06 g | 110.28 g | listed used | US food database (USDA Foundation Foods) #2259793 | C |
| 81.9 g | 94.19 g | 105.93 g | second database · not used | UK food tables (CoFID 2021) #12-184 | C | |
| Zinc | 0.428 mg | 0.49 mg | 0.55 mg | listed used | US food database (USDA Foundation Foods) #2259793 | C |
| 0.7 mg | 0.81 mg | 0.91 mg | second database · not used | UK food tables (CoFID 2021) #12-184 | C |
| Nutrient | Per 100 g | Per serving | Per 100 calories | How | Source | Grade |
|---|---|---|---|---|---|---|
| Beta-carotene | 5 µg | 5.75 µg | 6.47 µg | from SR Legacy used | US food database (USDA SR Legacy) #171284 | C |
| Copper | 0.003 mg | 0 mg | 0 mg | listed used | US food database (USDA Foundation Foods) #2259793 | C |
| Energy (Atwater general) | 77.952 kcal | 89.65 kcal | 100.82 kcal | listed used | US food database (USDA Foundation Foods) #2259793 | C |
| Energy (Atwater specific) | 77.319 kcal | 88.92 kcal | 100 kcal | listed used | US food database (USDA Foundation Foods) #2259793 | C |
| Nitrogen | 0.599 g | 0.69 g | 0.78 g | listed used | US food database (USDA Foundation Foods) #2259793 | C |
| Ash | 0.847 g | 0.97 g | 1.1 g | listed used | US food database (USDA Foundation Foods) #2259793 | C |
| Sucrose | 0 g | 0 g | 0 g | listed used | US food database (USDA Foundation Foods) #2259793 | C |
| Glucose | 0 g | 0 g | 0 g | listed used | US food database (USDA Foundation Foods) #2259793 | C |
| Fructose | 0 g | 0 g | 0 g | listed used | US food database (USDA Foundation Foods) #2259793 | C |
| Maltose | 0 g | 0 g | 0 g | listed used | US food database (USDA Foundation Foods) #2259793 | C |
| Alcohol, ethyl | 0 g | 0 g | 0 g | from SR Legacy used | US food database (USDA SR Legacy) #171284 | C |
| Caffeine | 0 mg | 0 mg | 0 mg | from SR Legacy used | US food database (USDA SR Legacy) #171284 | C |
| Theobromine | 0 mg | 0 mg | 0 mg | from SR Legacy used | US food database (USDA SR Legacy) #171284 | C |
| Energy | 257 kj | 295.55 kj | 332.39 kj | from SR Legacy used | US food database (USDA SR Legacy) #171284 | C |
| Sugars, Total | 4.094 g | 4.71 g | 5.29 g | listed used | US food database (USDA Foundation Foods) #2259793 | C |
| Galactose | 0.746 g | 0.86 g | 0.96 g | listed used | US food database (USDA Foundation Foods) #2259793 | C |
| Fluoride, F | 12 µg | 13.8 µg | 15.52 µg | from SR Legacy used | US food database (USDA SR Legacy) #171284 | C |
| Vitamin A, IU | 99 iu | 113.85 iu | 128.04 iu | from SR Legacy used | US food database (USDA SR Legacy) #171284 | C |
| Carotene, alpha | 0 µg | 0 µg | 0 µg | from SR Legacy used | US food database (USDA SR Legacy) #171284 | C |
| Vitamin D (D2 + D3), International Units | 31.1 iu | 35.77 iu | 40.22 iu | second database · not used | US food database (USDA Foundation Foods) #2259793 | C |
| Vitamin D2 (ergocalciferol) | 0 µg | 0 µg | 0 µg | second database · not used | US food database (USDA Foundation Foods) #2259793 | C |
| Vitamin D3 (cholecalciferol) | 0.778 µg | 0.9 µg | 1.01 µg | second database · not used | US food database (USDA Foundation Foods) #2259793 | C |
| Cryptoxanthin, beta | 0 µg | 0 µg | 0 µg | from SR Legacy used | US food database (USDA SR Legacy) #171284 | C |
| Lycopene | 0 µg | 0 µg | 0 µg | from SR Legacy used | US food database (USDA SR Legacy) #171284 | C |
| Biotin | 0 µg | 0 µg | 0 µg | listed used | US food database (USDA Foundation Foods) #2259793 | C |
| Vitamin K (Menaquinone-4) | 0.9 µg | 1.04 µg | 1.16 µg | listed used | US food database (USDA Foundation Foods) #2259793 | C |
| Vitamin K (Dihydrophylloquinone) | 0 µg | 0 µg | 0 µg | listed used | US food database (USDA Foundation Foods) #2259793 | C |
| Folic acid | 0 µg | 0 µg | 0 µg | from SR Legacy used | US food database (USDA SR Legacy) #171284 | C |
| Folate, food | 7 µg | 8.05 µg | 9.05 µg | from SR Legacy used | US food database (USDA SR Legacy) #171284 | C |
| Folate, DFE | 7 µg | 8.05 µg | 9.05 µg | from SR Legacy used | US food database (USDA SR Legacy) #171284 | C |
| Tryptophan | 0.02 g | 0.02 g | 0.03 g | from SR Legacy used | US food database (USDA SR Legacy) #171284 | C |
| Threonine | 0.142 g | 0.16 g | 0.18 g | from SR Legacy used | US food database (USDA SR Legacy) #171284 | C |
| Isoleucine | 0.189 g | 0.22 g | 0.24 g | from SR Legacy used | US food database (USDA SR Legacy) #171284 | C |
| Leucine | 0.35 g | 0.4 g | 0.45 g | from SR Legacy used | US food database (USDA SR Legacy) #171284 | C |
| Lysine | 0.311 g | 0.36 g | 0.4 g | from SR Legacy used | US food database (USDA SR Legacy) #171284 | C |
| Methionine | 0.102 g | 0.12 g | 0.13 g | from SR Legacy used | US food database (USDA SR Legacy) #171284 | C |
| Cystine | 0.032 g | 0.04 g | 0.04 g | from SR Legacy used | US food database (USDA SR Legacy) #171284 | C |
| Phenylalanine | 0.189 g | 0.22 g | 0.24 g | from SR Legacy used | US food database (USDA SR Legacy) #171284 | C |
| Tyrosine | 0.175 g | 0.2 g | 0.23 g | from SR Legacy used | US food database (USDA SR Legacy) #171284 | C |
| Valine | 0.287 g | 0.33 g | 0.37 g | from SR Legacy used | US food database (USDA SR Legacy) #171284 | C |
| Arginine | 0.104 g | 0.12 g | 0.13 g | from SR Legacy used | US food database (USDA SR Legacy) #171284 | C |
| Histidine | 0.086 g | 0.1 g | 0.11 g | from SR Legacy used | US food database (USDA SR Legacy) #171284 | C |
| Alanine | 0.148 g | 0.17 g | 0.19 g | from SR Legacy used | US food database (USDA SR Legacy) #171284 | C |
| Aspartic acid | 0.275 g | 0.32 g | 0.36 g | from SR Legacy used | US food database (USDA SR Legacy) #171284 | C |
| Glutamic acid | 0.679 g | 0.78 g | 0.88 g | from SR Legacy used | US food database (USDA SR Legacy) #171284 | C |
| Glycine | 0.084 g | 0.1 g | 0.11 g | from SR Legacy used | US food database (USDA SR Legacy) #171284 | C |
| Proline | 0.411 g | 0.47 g | 0.53 g | from SR Legacy used | US food database (USDA SR Legacy) #171284 | C |
| Serine | 0.215 g | 0.25 g | 0.28 g | from SR Legacy used | US food database (USDA SR Legacy) #171284 | C |
| Vitamin E, added | 0 mg | 0 mg | 0 mg | from SR Legacy used | US food database (USDA SR Legacy) #171284 | C |
| Vitamin B-12, added | 0 µg | 0 µg | 0 µg | from SR Legacy used | US food database (USDA SR Legacy) #171284 | C |
| SFA 4:0 | 0.096 g | 0.11 g | 0.12 g | from SR Legacy used | US food database (USDA SR Legacy) #171284 | C |
| SFA 6:0 | 0.066 g | 0.08 g | 0.09 g | from SR Legacy used | US food database (USDA SR Legacy) #171284 | C |
| SFA 8:0 | 0.042 g | 0.05 g | 0.05 g | from SR Legacy used | US food database (USDA SR Legacy) #171284 | C |
| SFA 10:0 | 0.093 g | 0.11 g | 0.12 g | from SR Legacy used | US food database (USDA SR Legacy) #171284 | C |
| SFA 12:0 | 0.115 g | 0.13 g | 0.15 g | listed used | US food database (USDA Foundation Foods) #2259793 | C |
| SFA 14:0 | 0.382 g | 0.44 g | 0.49 g | listed used | US food database (USDA Foundation Foods) #2259793 | C |
| SFA 16:0 | 1.066 g | 1.23 g | 1.38 g | listed used | US food database (USDA Foundation Foods) #2259793 | C |
| SFA 18:0 | 0.372 g | 0.43 g | 0.48 g | listed used | US food database (USDA Foundation Foods) #2259793 | C |
| MUFA 18:1 | 0.743 g | 0.85 g | 0.96 g | from SR Legacy used | US food database (USDA SR Legacy) #171284 | C |
| PUFA 18:2 | 0.065 g | 0.07 g | 0.08 g | from SR Legacy used | US food database (USDA SR Legacy) #171284 | C |
| PUFA 18:3 | 0.027 g | 0.03 g | 0.03 g | from SR Legacy used | US food database (USDA SR Legacy) #171284 | C |
| PUFA 20:4 | 0 g | 0 g | 0 g | from SR Legacy used | US food database (USDA SR Legacy) #171284 | C |
| PUFA 22:6 n-3 (DHA) | 0 g | 0 g | 0 g | from SR Legacy used | US food database (USDA SR Legacy) #171284 | C |
| MUFA 16:1 | 0.071 g | 0.08 g | 0.09 g | from SR Legacy used | US food database (USDA SR Legacy) #171284 | C |
| PUFA 18:4 | 0 g | 0 g | 0 g | from SR Legacy used | US food database (USDA SR Legacy) #171284 | C |
| MUFA 20:1 | 0 g | 0 g | 0 g | from SR Legacy used | US food database (USDA SR Legacy) #171284 | C |
| PUFA 20:5 n-3 (EPA) | 0 g | 0 g | 0 g | from SR Legacy used | US food database (USDA SR Legacy) #171284 | C |
| MUFA 22:1 | 0 g | 0 g | 0 g | from SR Legacy used | US food database (USDA SR Legacy) #171284 | C |
| PUFA 22:5 n-3 (DPA) | 0 g | 0 g | 0 g | from SR Legacy used | US food database (USDA SR Legacy) #171284 | C |
| Fatty acids, total monounsaturated | 0.874 g | 1 g | 1.13 g | listed used | US food database (USDA Foundation Foods) #2259793 | C |
| Fatty acids, total polyunsaturated | 0.092 g | 0.11 g | 0.12 g | from SR Legacy used | US food database (USDA SR Legacy) #171284 | C |
| MUFA 18:1 c | 0.766 g | 0.88 g | 0.99 g | listed used | US food database (USDA Foundation Foods) #2259793 | C |
| PUFA 18:2 n-6 c,c | 0.082 g | 0.09 g | 0.11 g | listed used | US food database (USDA Foundation Foods) #2259793 | C |
| Iodine | 32 µg | 36.8 µg | 41.39 µg | listed used | USDA iodine database (2024) #Yogurt, whole milk, plain | C |
| 63 µg | 72.45 µg | 81.48 µg | second database · not used | UK food tables (CoFID 2021) #12-184 | C | |
| 32.33 µg | 37.18 µg | 41.81 µg | second database · not used | US food database (USDA Foundation Foods) #2259793 | C | |
| Lactose | 3.348 g | 3.85 g | 4.33 g | listed used | US food database (USDA Foundation Foods) #2259793 | C |
| 4.7 g | 5.41 g | 6.08 g | second database · not used | UK food tables (CoFID 2021) #12-184 | C | |
| Lutein + zeaxanthin | 0 µg | 0 µg | 0 µg | from SR Legacy used | US food database (USDA SR Legacy) #171284 | C |
| Manganese | 0.002 mg | 0 mg | 0 mg | listed used | US food database (USDA Foundation Foods) #2259793 | C |
| Niacin (B3, preformed) | 0.135 mg | 0.16 mg | 0.17 mg | listed used | US food database (USDA Foundation Foods) #2259793 | C |
| 0.2 mg | 0.23 mg | 0.26 mg | second database · not used | UK food tables (CoFID 2021) #12-184 | C | |
| Pantothenic acid (B5) | 0.389 mg | 0.45 mg | 0.5 mg | from SR Legacy used | US food database (USDA SR Legacy) #171284 | C |
| 0.5 mg | 0.58 mg | 0.65 mg | second database · not used | UK food tables (CoFID 2021) #12-184 | C | |
| Retinol | 48.19 µg | 55.42 µg | 62.33 µg | listed used | US food database (USDA Foundation Foods) #2259793 | C |
| 28 µg | 32.2 µg | 36.21 µg | second database · not used | UK food tables (CoFID 2021) #12-184 | C |
Change the amount to rescale the first column. Nutrients a database doesn't list are missing, not zero.
Absorption studies
Studies of how much of a nutrient gets in; those done in animals are marked. This page quotes a figure only from a study that passes our screen: adults, graded A, of this food in this preparation, with a test dose on record and a source that has passed our evidence check. The exception is calcium on our calcium card: its figure comes from the card’s own study, checked with the card, and is marked “used” even where that study misses a step of this screen. The others are listed so nothing is hidden, each with the first check it fails.
No study of this food passes the screen yet, so no absorption figure is quoted.
| Study | Nutrient | Absorbed | Test dose | People | Grade | On this page |
|---|---|---|---|---|---|---|
| Wynckel et al. 1991: yogurt, lactase-deficient L(-) commercial unflavoured; fat level not stated · commercial unflavoured yogurt (Danone BSN, France) used 3 d after manufacture; 125 g three times a day for 8 d before the test; 12 h fast full text read | Calcium | 23.5 % | 200 mg | 7 | B | Not used: not graded A, so not a direct human study of this food and preparation. |
| Recker et al. 1988: yogurt home-made from 2% milk, Dannon culture; flavouring not stated · yogurt made from scalded 2% milk and yogurt culture (Dannon); 45Ca added immediately before incubation in a home-use yogurt maker; fasting, 2 h fast after full text read | Calcium | 25.4 % | 250 mg | 10 | A | Not used: we haven’t confirmed how the food was prepared in this study. |
| Wynckel et al. 1991: yogurt, lactase-normal L(+) commercial unflavoured; fat level not stated · commercial unflavoured yogurt (Danone BSN, France) used 3 d after manufacture; subjects had eaten 125 g three times a day for 8 d before the test; 12 h fast full text read | Calcium | 26.9 % | 200 mg | 7 | B | Not used: not graded A, so not a direct human study of this food and preparation. |
| Nickel et al. 1996: yogurt (intrinsic 44Ca) not stated · yogurt made from intrinsically 44Ca-labelled milk, eaten with breakfast after an overnight fast (as described in a review table); culture and fat level not stated secondary source | Calcium | 24.2 % | 523 mg | 7 | B | Not used: we haven’t confirmed how the food was prepared in this study. |
| Hodgkinson et al. 2025: yogurt (pig) animal study plain unsweetened yogurt · Unflavoured, fed as received · diet protein level not read; ration 0.08 x metabolic body weight (kg^0.75) per day full text read | Protein | 93.3 % | not reported | 6 | B | Not used: we haven’t confirmed how the food was prepared in this study. |
| Bonjour et al. 2018: yogurt fortified yogurt (not plain unfortified) · D3-fortified yogurt with 400 mg calcium and 5 g protein per 125-g pot · one 125-g D3-fortified yogurt a day = 5 ug D3 (label/design); analysed content not found in the text read full text read | Vitamin D | – | not reported | 44 | A | Not used: it measures something other than the share absorbed. |
Hazard rows as the dataset rates them
- Cadmium · Nothing to watch: under the limit · A daily serving adds 0.15% to an average adult's cadmium intake (EFSA 2012 adult median, 1.77 µg/kg body weight/week; Canadian adults in 2007: 1.2-1.75), far from doubling it, so no cap. · Health Canada Total Diet Study, trace elements · A
- Dairy and ciprofloxacin · Worth knowing · Worded as the label puts it: the ciprofloxacin label names yogurt; it is not to be taken with dairy alone, but may be taken with a meal that contains it. · Ciprofloxacin Tablets, USP, US generic label · B
- Histamine · Nothing to watch: under the limit · No cap for healthy adults: EFSA's no-effect level is 50 mg of histamine per meal. The highest of 16 cow's-milk yogurts measured 3.05 mg/kg (14 had none detected), so a 115 g serving carries at most 0.35 mg, 0.7% of it. Sheep's-milk yogurts in the same study reached 17.16 mg/kg (1.97 mg per serving, 3.9%). EFSA's level for people with histamine intolerance is 'below detectable limits'. · Moniente 2023 · A
- Lead · Nothing to watch: doesn’t double average intake · Lower bound 0.697, upper bound 0.826 µg/kg (2 of 17 composites non-detect, detection limits 0.39 and 1.8, counted as 0 in the lower bound). A daily serving adds 0.23-0.27% to EFSA's average adult intake (35 µg/day), so no cap. 2016-18 mean 0.494 (n 3). FDA Total Diet Study lowfat vanilla and lowfat fruit-flavored yogurt: 0 of 3 detects each, reporting limit 4 µg/kg (an upper bound at that limit would be 0.46 µg per serving, 1.3%). · Health Canada Total Diet Study, trace elements · A
- Milk allergy · Worth knowing · Milk is a Health Canada priority allergen; the Health Canada milk page lists yogurt among common sources of milk · Health Canada 2017 · A
Oxalate, phytate and gut-tolerance measurements
- histamine: not detected in 14 of 16 cow's-milk yogurts; quantified 0.819 and 3.054 mg/kg in the other 2 (detection limit below 0.2 mg/L) mg/kg · as sold · retail and manufacturer-supplied yogurt, Spain; frozen at -18 C until analysis · grade A · Moniente 2023
- histamine: not detected (n = 5) mg/kg · as sold · yogurt (Spanish market) · grade A · Sanchezperez 2021
- histamine: mean 0.5 · max 1 · 14% below the detection limit · n 7 mg/kg · fresh weight (as sold) · yoghurt · grade B · EFSA 2011
- lactose: range over 13 commercial plain yogurts g/100 g · as sold · commercial plain yogurts, Croatia · grade A · Kenjeric 2016
- lactose: about 2.3 after 11 d storage, vs 4.8 in non-fermented milk (same study) g/100 g · not stated · yogurt stored 11 days (1982 study) · grade A · PubMed 7076958
- lactose: n = 8 g/100 g · as sold · USDA Foundation 'Yogurt, plain, whole milk' · grade B · US food database (USDA Foundation Foods)
- lactose: 14 observations g/100 g · as sold · CNF 6961 'Yogourt (yogurt), 2-3.9% M.F., plain' · grade B · Canadian Nutrient File 2026
- lactose: about 6.5 g per 125 g yogurt; source of the figure not stated g/100 g (derived: 6.5 g / 125 g) · as sold · commercial unflavoured yogurt (Danone BSN), 3 d after manufacture · grade C · PubMed 1747199
- lactose: 4.7 g/100 g · as listed · Yogurt, whole milk, plain · grade B · UK food tables (CoFID 2021)
- lactose: range 2176–2477 mg/100 g (range 2176-2477) · as sold · 'zero % Greek style' yogurt (flavoured and natural) · grade A · Shakerdi 2022
- lactose: range 2.65–4.05 g/100 g (range 2.65-4.05) · as sold (plain yogurts); basis not stated · plain yogurts, Croatian market · grade A · Kenjeric 2016
- oxalate total: 4 mg per 6 oz (170 g) serving mg/100 g · as eaten (fresh weight) · yogurt, fresh and frozen, variety, multi-brands (as listed) · grade B · Oxalosis & Hyperoxaluria Foundation, Dairy oxalate list
- oxalate total: 2 mg per 1 cup (cup weight not given) mg per cup · as eaten · 'Plain Yogurt' (as listed) · grade B · Uci 2020
- tyramine: not detected (n 5) mg/kg · fresh weight · yogurt, as sold · grade B · Sanchezperez 2021
- tyramine: mean 1.9 · max 5.2 · 29% below the detection limit · n 7 mg/kg · fresh weight (as sold) · yoghurt · grade B · EFSA 2011
Sources
- Ciprofloxacin Tablets, USP, US generic label (copy on DrugCentral; Blu Pharmaceuticals named for adverse-event reporting)
cipro-label-drugcentral· page · Product label (manufacturer copyright) - Health Canada, Canadian Nutrient File 2026 (14th edition)
cnf-2026· dataset · Open Government Licence – Canada 2.0 - Public Health England, Composition of Foods Integrated Dataset (CoFID) 2021
cofid-2021· dataset · Open Government Licence v3.0 - EFSA Panel on Biological Hazards (BIOHAZ). Scientific opinion on risk based control of biogenic amine formation in fermented foods. EFSA Journal 2011;9(10):2393. · doi:10.2903/j.efsa.2011.2393
efsa2011· full text read · EFSA copyright (free to read) - USDA FoodData Central, Foundation Foods, release 2026-04-30
fdc-foundation-2026-04-30· dataset · CC0 1.0 (public domain) - USDA FoodData Central, SR Legacy, 2018-04
fdc-sr-legacy-2018-04· dataset · CC0 1.0 (public domain) - Health Canada, Milk - A priority food allergen (page details 2017-09-05)
hc-milk-allergen-2017· page · Government of Canada terms (Crown copyright; not OGL) - Health Canada, Canadian Total Diet Study – Trace Elements (2005–2018 composites)
hc-tds-trace-elements· dataset · Open Government Licence – Canada 2.0 - Kenjerić D, Nieder D, Cvijetić Stokanović M, Flanjak I. Assessment of fermented dairy products adequacy in diet of lactose intolerant persons. Hrana u zdravlju i bolesti 2016;5(1):1-5
kenjeric2016· abstract only · journal page (licence not checked) - Moniente M, Botello-Morte L, García-Gonzalo D, Virto R, Pagán R, Ferreira V, Ontanón I. Combination of SPE and fluorescent detection of AQC-derivatives for the determination at sub-mg/L levels of biogenic amines in dairy products. Food Res Int 2023;165:112448 · doi:10.1016/j.foodres.2022.112448
moniente2023· full text read · repository copy; licence not checked - Oxalosis & Hyperoxaluria Foundation, Dairy oxalate list (web page, (c) 2026, no version date)
ohf-dairy-oxalate· page · not stated - Wynckel A, Jaisser F, Wong T, Drüeke T, Chanard J. Intestinal absorption of calcium from yogurt in lactase-deficient subjects. Reprod Nutr Dev 1991;31:411-8 · doi:10.1051/rnd:19910407 · PMID 1747199
pmid:1747199· full text read · HAL open-archive copy - Bonjour JP, et al. Evolution of serum 25OHD in response to vitamin D3-fortified yogurts consumed by healthy menopausal women: a 6-month randomized controlled trial. J Am Coll Nutr 2018;37:34-43. · doi:10.1080/07315724.2017.1355761 · PMID 28976265
pmid:28976265· full text read · licence not recorded - Recker RR, Bammi A, Barger-Lux MJ, Heaney RP. Calcium absorbability from milk products, an imitation milk, and calcium carbonate. Am J Clin Nutr 1988;47:93–5 · doi:10.1093/ajcn/47.1.93 · PMID 3337043
pmid:3337043· full text read · Publisher copyright (journal article) - Alm L. Effect of fermentation on lactose, glucose, and galactose content in milk and suitability of fermented milk products for lactose intolerant individuals. J Dairy Sci 1982;65:346-52 · doi:10.3168/jds.S0022-0302(82)82198-X · PMID 7076958
pmid:7076958· abstract only · Publisher copyright (journal article) - Nickel KP, Martin BR, Smith DL, Smith JB, Miller GD, Weaver CM. Calcium bioavailability from bovine milk and dairy products in premenopausal women using intrinsic and extrinsic labeling techniques. J Nutr 1996;126:1406-11 · doi:10.1093/jn/126.5.1406 · PMID 8618137
pmid:8618137· secondary source · Publisher copyright (journal article) - Hodgkinson SM, Stroebinger N, Stein HH, Fanelli NS, de Vries S, van der Wielen N, et al. True ileal amino acid digestibility of human foods classified according to food type as determined in the growing pig. J Nutr 2025;155:3384-3400. · doi:10.1016/j.tjnut.2025.08.004 · PMID 40812478
pq_hodgkinson2025· full text read · CC BY (Europe PMC licence field) - Sánchez-Pérez S et al. 2021, Nutrients 13:1395, Table 1 (histamine)
sanchezperez2021· full text read · CC BY 4.0 - Shakerdi LA, Wallace L, Smyth G, Madden N, Clark A, Hendroff U, McGovern M, Connellan S, Gillman B, Treacy EP. Determination of the lactose and galactose content of common foods: relevance to galactosemia. Food Sci Nutr 2022;10:3789-3800 · doi:10.1002/fsn3.2976 · PMID 36348783
shakerdi2022· full text read · CC BY (Wiley open access) - UCI Kidney Stone Center, Oxalate Content of Foods (PDF, uploaded 2020-06)
uci-oxalate-2020· page · not stated - USDA, FDA and ODS-NIH Database for the Iodine Content of Common Foods, Release 4.0 (October 2024; 478 foods). Prepared by Heydorn K, Wambogo E, Spungen JH, Ershow AG, Gahche JJ, Haggans C, Merkel J, Patterson KY, Pehrsson PR. USDA ARS Methods and Application of Food Composition Laboratory.
usda-iodine-db4· secondary source · US Government work (public domain; USDA ARS)
Body map 2026-10-25.1: each nutrient’s job comes from an agency fact sheet, linked beside it under Good for.
The plain words: “a lot” means one serving (100 g when the food has no serving size) gives at least 20% of the daily amount (the reference intake), “some” at least 10%, “a little” at least 2% (the cut-offs are ours, one set for every page: 20% and 10% are borrowed from the US labelling terms “high” and “good source” and applied to Health Canada’s daily amount, whereas Health Canada’s own shopper rule says 15%; provisional: they may change in a later method version). The daily amount is Health Canada’s Dietary Reference Intake for adults 19–30; where men and women need different amounts we use the higher one (protein: 56 g for men, 46 g for women). The percentage printed under each nutrient is the printed amount as a share of that daily amount, rounded to the nearest whole number, and the word is read from that percentage, so the amount, the percentage and the word always agree. Calcium with a measured absorption is scaled by how well it gets in compared with milk.
The scale: “Nothing to watch” means a serving a day stays under the limit at ordinary amounts; “Go easy” means a serving a day can push past the limit for adults who already take in the most, or fewer than 2 servings reach it; “Limit it” means once a week or less. The dataset’s own rating is under “How we got this”. Provisional: the scale may change in a later method version.
Measured absorption under Good for: grade-A studies in adults that tested this preparation of this food, as a share of the listed amount (the share digested, for protein), quoted once each source has passed our evidence check; animal studies and other variants stay in the table above. Provisional: this screen may change in a later method version.