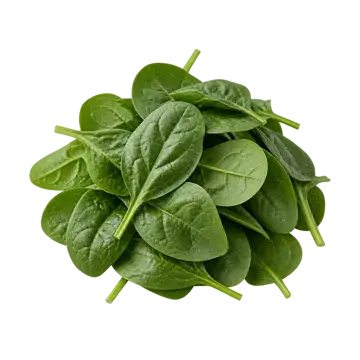
Spinach, raw
Checked by us One serving: 85 g (about 3 cups) · 18 kcal
Lots of vitamin K1, vitamin A and vitamin C. Rich in 2 more nutrients: see Good for.
Go easy: cadmium can add up. Its calcium barely gets in.
On warfarin? Keep your vitamin K steady. Had calcium-oxalate kidney stones? The usual advice: limit oxalate-rich foods; ask your care team how much suits you. Worth knowing for some people: uncooked frozen vegetables.
Good for
How we counted this
What one serving (85 g) gives you.
Your body needs enough of each of these. Past enough, more doesn’t help. Amounts are what the food databases list, not what your body absorbs, unless a row says it was measured.
The words: “A lot” means one serving gives 20% or more of Health Canada’s daily amount, “Some” 10% to 19%, “A little” 2% to 9%, “Almost none” under 2%. Strongest word first; within a word, protein and fibre lead, then the biggest share. ?
A milligram (mg) is a thousandth of a gram, and a microgram (µg) a thousandth of a milligram: 1,000 µg make 1 mg.
- A lot
Vitamin K1
Your blood needs it to clot.
Learn more
410 µg in one serving: 342% of the 120 µg a day men need, 456% of the 90 µg women need. The word follows the smaller share, which is the share of the higher amount. ?
Source: How much of it gets in hasn’t been measured for this food yet. NIH Office of Dietary Supplements, vitamin K fact sheet for health professionals
- A lot
Vitamin A
Your eyes need it to see in dim light.
Learn more
Getting enough matters; more than enough doesn’t sharpen your sight.
260 µg in one serving: 29% of the 900 µg a day men need, 37% of the 700 µg women need. The word follows the smaller share, which is the share of the higher amount. ?
Source: How much of it gets in hasn’t been measured for this food yet. NIH Office of Dietary Supplements, vitamin A fact sheet for health professionals
- A lot
Vitamin C
Your body makes collagen with it, which wounds need to heal. It also helps you absorb iron from plants.
Learn more
25.7 mg in one serving: 29% of the 90 mg a day men need, 34% of the 75 mg women need. The word follows the smaller share, which is the share of the higher amount. ?
Source: How much of it gets in hasn’t been measured for this food yet. NIH Office of Dietary Supplements, vitamin C fact sheet for health professionals
- A lot
Folate
Your body needs it to make DNA and to divide new cells.
Learn more
96.4 µg in one serving: 24% of the 400 µg a day.
Listed amount only. 2 absorption studies of this nutrient are on file for this food, but none is quoted yet. Each one is in The numbers, with the reason. See the studies
Source: NIH Office of Dietary Supplements, folate fact sheet for health professionals
- A lot
Magnesium
Your muscles and nerves need it to work.
Learn more
79 mg in one serving: 20% of the 400 mg a day men need, 25% of the 310 mg women need. The word follows the smaller share, which is the share of the higher amount. ?
Listed amount only. 1 absorption study of this nutrient is on file for this food, but none is quoted yet. Each one is in The numbers, with the reason. See the studies
Source: NIH Office of Dietary Supplements, magnesium fact sheet for health professionals
17 more nutrients below “a lot”
- Some
Vitamin B6
Helps you use protein, and your brain needs it to make its chemical messengers.
Learn more
0.18 mg in one serving: 14% of the 1.3 mg a day.
Source: How much of it gets in hasn’t been measured for this food yet. NIH Office of Dietary Supplements, vitamin B6 fact sheet for health professionals
- Some
Riboflavin (B2)
Your cells use it to make energy and handle fats. It also helps turn tryptophan into niacin and activate vitamin B6.
Learn more
0.16 mg in one serving: 12% of the 1.3 mg a day men need, 15% of the 1.1 mg women need. The word follows the smaller share, which is the share of the higher amount. ?
Listed amount only. 1 absorption study of this nutrient is on file for this food, but none is quoted yet. Each one is in The numbers, with the reason. See the studies
Source: NIH Office of Dietary Supplements, riboflavin fact sheet for health professionals
- Some
Vitamin E
Shields the fats in your cells from damage; your immune system uses it too.
Learn more
1.73 mg in one serving: 12% of the 15 mg a day.
Listed amount only. 1 absorption study of this nutrient is on file for this food, but none is quoted yet. Each one is in The numbers, with the reason. See the studies
Source: NIH Office of Dietary Supplements, vitamin E fact sheet for health professionals
- Some
Potassium
Your nerves, muscles and kidneys need it to work.
Learn more
391 mg in one serving: 12% of the 3,400 mg a day men need, 15% of the 2,600 mg women need. The word follows the smaller share, which is the share of the higher amount. ?
Source: How much of it gets in hasn’t been measured for this food yet. NIH Office of Dietary Supplements, potassium fact sheet for health professionals
- A little
Omega-3: ALA
The one omega-3 your body can’t make: it must come from food. Your cells build it into their membranes and burn it for energy.
Learn more
117 mg in one serving: 7% of the 1,600 mg a day men need, 11% of the 1,100 mg women need. The word follows the smaller share, which is the share of the higher amount. ?
Source: How much of it gets in hasn’t been measured for this food yet. NIH Office of Dietary Supplements, omega-3 fatty acids fact sheet for health professionals
- A little
Niacin (B3, niacin equivalents)
More than 400 of your enzymes need it to work.
Learn more
1.17 mg in one serving: 7% of the 16 mg a day men need, 8% of the 14 mg women need. The word follows the smaller share, which is the share of the higher amount. ?
Source: How much of it gets in hasn’t been measured for this food yet. NIH Office of Dietary Supplements, niacin fact sheet for health professionals
- A little
Thiamin (B1)
Your cells use it to get energy from food, and so to grow and work.
Learn more
0.07 mg in one serving: 6% of the 1.2 mg a day men need, 6% of the 1.1 mg women need. The word follows the smaller share, which is the share of the higher amount. ?
Source: How much of it gets in hasn’t been measured for this food yet. NIH Office of Dietary Supplements, thiamin fact sheet for health professionals
- A little
Iron
Carries oxygen in your blood.
Learn more
0.9 mg in one serving: 11% of the 8 mg a day men need, 5% of the 18 mg women need. The word follows the smaller share, which is the share of the higher amount. ?
Listed amount only. 1 absorption study of this nutrient is on file for this food, but none is quoted yet. Each one is in The numbers, with the reason. See the studies
Source: NIH Office of Dietary Supplements, iron fact sheet for health professionals
- A little
Protein
Your muscles, and every other tissue, are built and repaired from it.
Learn more
2.47 g in one serving: 4% of the 56 g a day men need, 5% of the 46 g women need. The word follows the smaller share, which is the share of the higher amount. ?
Source: How much of it gets in hasn’t been measured for this food yet. Institute of Medicine 2005, Dietary Reference Intakes for Energy, Carbohydrate, Fiber, Fat, Fatty Acids, Cholesterol, Protein, and Amino Acids
- A little
Fibre
Keeps your gut moving.
Learn more
1.35 g in one serving: 4% of the 38 g a day men need, 5% of the 25 g women need. The word follows the smaller share, which is the share of the higher amount. ?
Source: How much of it gets in hasn’t been measured for this food yet. Institute of Medicine 2005, Dietary Reference Intakes for Energy, Carbohydrate, Fiber, Fat, Fatty Acids, Cholesterol, Protein, and Amino Acids
- A little
Zinc
Your immune system and healing wounds depend on it.
Learn more
0.36 mg in one serving: 3% of the 11 mg a day men need, 5% of the 8 mg women need. The word follows the smaller share, which is the share of the higher amount. ?
Source: How much of it gets in hasn’t been measured for this food yet. NIH Office of Dietary Supplements, zinc fact sheet for health professionals
- A little
Choline
Your cells need it for their membranes, and to make acetylcholine, a messenger for memory, mood and muscle control.
Learn more
16.4 mg in one serving: 3% of the 550 mg a day men need, 4% of the 425 mg women need. The word follows the smaller share, which is the share of the higher amount. ?
Source: How much of it gets in hasn’t been measured for this food yet. NIH Office of Dietary Supplements, choline fact sheet for health professionals
- Almost none
Calcium
Builds your bones and teeth.
Learn more
Listed: 56.6 mg. The word above is read from how well this calcium gets in compared with milk’s: 56.6 mg × 5.1% (gets in from this food) ÷ 32.1% (from milk) = 8.99 mg, counted as milk’s calcium, which is 1% of 1,000 mg a day. See Watch out.
Source: NIH Office of Dietary Supplements, calcium fact sheet for health professionals
- Almost none
Omega-3: EPA + DHA
Long-chain omega-3s, built into your cell membranes. DHA is concentrated in your brain and retinas.
Learn more
0 mg in one serving: under 1% of the 250 mg a day.
Health Canada sets no daily amount for these fats, so the daily figure here is the European Food Safety Authority’s.
Source: How much of it gets in hasn’t been measured for this food yet. NIH Office of Dietary Supplements, omega-3 fatty acids fact sheet for health professionals
- Almost none
Selenium
Your thyroid uses it to make its hormones.
Learn more
0 µg in one serving: under 1% of the 55 µg a day.
Source: How much of it gets in hasn’t been measured for this food yet. NIH Office of Dietary Supplements, selenium fact sheet for health professionals
- Almost none
Vitamin B12
Your body needs it to make red blood cells and keep nerves working.
Learn more
0 µg in one serving: under 1% of the 2.4 µg a day.
Source: How much of it gets in hasn’t been measured for this food yet. NIH Office of Dietary Supplements, vitamin B12 fact sheet for health professionals
- Almost none
Vitamin D
Your body needs it to absorb calcium and keep your bones hard.
Learn more
Your skin also makes it in sunlight, so food is only one of its sources.
0 µg in one serving: under 1% of the 15 µg a day.
Source: How much of it gets in hasn’t been measured for this food yet. NIH Office of Dietary Supplements, vitamin D fact sheet for health professionals
From our evidence: Spinach: what's on the label, and what the studies found gets in →
Watch out
How we counted this
Cadmium
Go easyBuilds up in the kidneys over years.
From our evidence: Cadmium: the dose, not the presence →
Learn more
470 g a week takes an average adult to the limit
You’d need about 5.5 servings a week of this food alone to use up what an average adult’s intake leaves under the limit.
“Go easy” here because, for adults who already take in the most from other food, a serving a day can push past the limit.
One serving carries 9.2 µg
How we got this
A serving a day adds 52% to what an average adult already takes in: a share of that intake, not of the limit. With that serving every day, an average adult would be at about 108% of the limit.
An average adult already takes in about 71% of the limit. One serving a day uses up the room left in about 5.5 days of the week.
Counted from zero, with no allowance for what adults already take in from other food, 1,600 g a week would reach the limit.
Why this rating: Eating it daily comes to 595 g a week, which is more than the 470 g of room left before the limit.
The dataset’s rating: Go easy: can push past the limit
The dataset’s original note, counted from zero and kept as written: A daily serving adds 52% to an average adult's cadmium intake (EFSA 2012 adult median, 1.77 µg/kg body weight/week; Canadian adults in 2007: 1.2-1.75), short of doubling it, so no cap.
Health Canada, Canadian Total Diet Study – Trace Elements (2005–2018 composites) · grade A
Calcium
BarelyThe label says 56.6 mg of calcium. Your body gets about 2.9 mg.
From our evidence: Calcium on the label vs calcium absorbed →
Learn more
In people who ate it, about 5.1% of its calcium got in. The likely reason: it’s very high in oxalate, which grabs calcium and locks it away before the gut can take it up.
tested at 200 mg · Heaney, Weaver & Recker 1988: spinach · grade A
⚑ The study's dose was more than twice one serving's calcium.
◇ The study doesn't say how the food was prepared.
- 9Spinach, raw85 g · 5.1% gets in · tested at 200 mg ⚑ ◇3mglabel 57
- 9
Checked for lead: fine at normal amounts.
Lead
Nothing to watchYou’d need about 35 servings a day, every day, of this food alone to double the lead an average adult already gets. No dose is known to be safe, so doubling is where we flag.
Learn more
A serving a day adds 2.9% to what an average adult already takes in. There is no limit to take a share of.
One serving carries 1 µg
How we got this
The dataset’s rating: Nothing to watch: doesn’t double average intake
adds 2.9% to average intake
Health Canada, Canadian Total Diet Study – Trace Elements (2005–2018 composites) · grade A
For some people
Don't eat frozen spinach uncooked if pregnant, 60+, under 5 or immunocompromised
With warfarin: keep vitamin K intake consistent
Learn more
Eat a steady amount, not none. This line goes on every food whose serving gives 10% or more of the daily vitamin K; a few foods below that carry it too, where a source names them. One serving here has about 410 µg of vitamin K1.
A serving carries more oxalate than its own calcium can bind.
Learn more
Most kidney stones are calcium oxalate. If you’ve had these stones, the usual advice is to limit oxalate-rich foods and to ask your care team how much oxalate suits you; that advice is written for people who have had them.
Source: Siener, Nutrients 2021: Nutrition and kidney stone disease · NIDDK, Eating, diet and nutrition for kidney stones
How we got this
The method flags a food when a serving carries more than 13 mg of oxalate beyond what its own calcium can bind.
Worth knowing
No limit applies, so none is rated.
Sugar
0.4 g of sugar in a 85 g serving, natural and added together.
Learn more
Shown, not rated. The food tables we read give total sugar, and few give added sugar, so the site can’t yet tell sugar added in making a food from the sugar in fruit or milk.
Also measured in it
Figures from the dataset. None has a limit to be rated against, so none is a verdict.
Tyramine: 2.1 mg per kg fresh weight, so about 0.17 mg in a 85 g serving. (mean 2.05 · standard deviation 0.83 · range 0.79–4.28 · 0% below the detection limit · n 18) · Sanchezperez 2021 · grade B
For scale, EFSA found no reported ill effects at 6 mg of tyramine in a meal for people on the older MAO-inhibitor antidepressants, 50 mg for those on the newer ones and 600 mg for healthy people not taking them, based on limited data. EFSA 2011
Also checked (nothing to act on) · 1
Noted for context, or not measured in this food yet.
Context only: 35% of the acceptable daily intake (ADI) per serving
Better options
How we counted this
“Better” here always means better at something the row names: more of one nutrient, more nutrients per serving, or the goal you pick. It never means better in every way.
Every amount below is for the same weight, 85 g, the size of one serving of this food, so a swap compares like with like. A serving of another food can be bigger or smaller.
A food is listed only if it gives clearly more: at least a fifth more than this food, and at least 10% of the daily amount more.
If you eat it for calcium
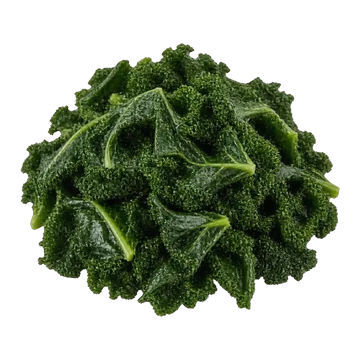 Kale, cooked52.1 mg absorbed per serving
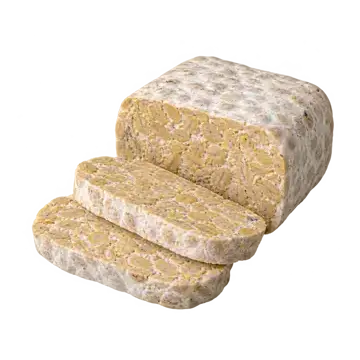 Tempeh34.8 mg absorbed per serving
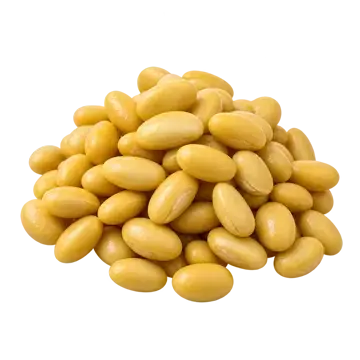 Soybeans, cooked28.7 mg absorbed per serving
More of what it’s good for
More vitamin A
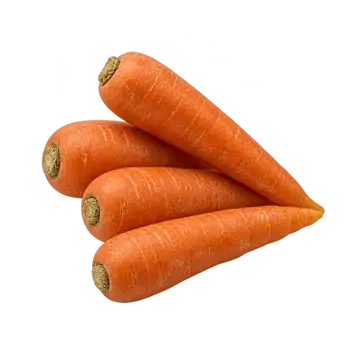 Carrots, raw710 µg in 85 g (this food: 260 µg) · but less vitamin K1 and vitamin C
- Spinach, cooked445 µg in 85 g (this food: 260 µg) · but less vitamin CCadmium: go easy · this food has it too
More vitamin C
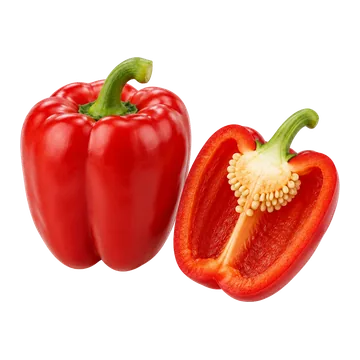 Red pepper, raw109 mg in 85 g (this food: 25.7 mg) · but less vitamin K1 and vitamin A
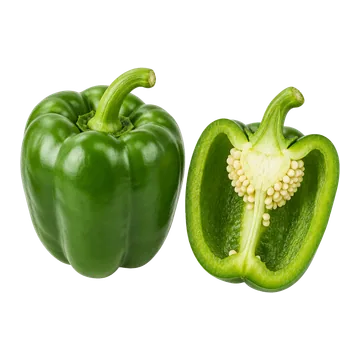 Green pepper, raw84.6 mg in 85 g (this food: 25.7 mg) · but less vitamin K1 and vitamin A
Amounts as listed, not adjusted for how much gets in.
For vitamin K1: Mustard greens, cooked would lead, in the same 85 g, but is left out (not tested for contaminants yet).
More nutrients per serving, counted together
The other vegetables we’ve checked with more nutrients per serving than this one, counting at most 100 kcal. One score ranks them all, so the same few often lead.
- Spinach, cooked
- More vitamin A (445 µg vs 260 µg)
- More iron (3.03 mg vs 0.9 mg)
- Less vitamin C (8.33 mg vs 25.7 mg)
1 food out of the 24 other vegetables we’ve checked and could compare gives clearly more nutrients per serving.
Where the calcium card measured that less calcium gets in than from milk, calcium counts for less; everything else is as listed.
Your goal
Your goal changes only this list, not what the food gives you or what to watch.
Losing weight: fewer calories, and more nutrients, protein and fibre for each calorie.
- Spinach, cooked
- More vitamin A (445 µg vs 260 µg)
- More iron (3.03 mg vs 0.9 mg)
- Less vitamin C (8.33 mg vs 25.7 mg)
1 food out of the 24 other vegetables we’ve checked and could compare gives clearly more nutrients, protein and fibre per calorie.
Building muscle: more protein and more calories, per 100 g. In a typical diet most protein comes from other foods; among vegetables, these help most.
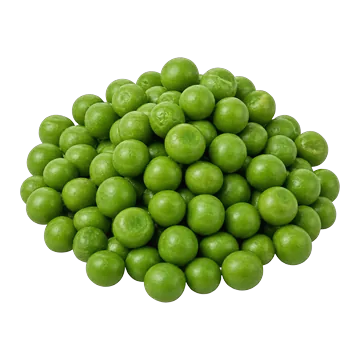 Green peas, cooked5.2 g protein · 78 kcal per 100 g
1 food out of the 24 other vegetables we’ve checked and could compare gives clearly more protein, and more calories, per 100 g.
Why some foods aren’t suggested
Left out: Mustard greens, cooked (not tested for contaminants yet).
Left out: Edamame, cooked (not tested for contaminants yet).
Bring a tracker export or describe your usual week. The same rules check all of it.
The numbers
Open every value
Name in the database: Spinach, raw
How the serving was set: 85 g (Health Canada V.1)
Listed nutrients, per 100 g
For each nutrient, the value this page uses is marked “used”. A row marked “second database” is another database’s figure for a matching food, kept so you can see how far databases disagree (they can differ in the samples analysed, lab methods and rounding). Its own cells are worked out from it, but none of the page’s words or scores are.
| Nutrient | Per serving | Per 100 calories | How | Source | Grade | |
|---|---|---|---|---|---|---|
| Omega-3: ALA | 0.138 g | 0.12 g | 0.64 g | from SR Legacy used | US food database (USDA SR Legacy) #168462 | C |
| Calcium | 66.64 mg | 56.64 mg | 308.81 mg | listed used | US food database (USDA Foundation Foods) #1999633 | C |
| 170 mg | 144.5 mg | 787.78 mg | second database · not used · 2.6× | UK food tables (CoFID 2021) #13-572 | C | |
| 99 mg | 84.15 mg | 458.76 mg | copy of USDA · not used | Canadian Nutrient File 2026 #2213 | C | |
| Carbohydrate | 2.641 g | 2.25 g | 12.24 g | listed used | US food database (USDA Foundation Foods) #1999633 | C |
| Choline | 19.3 mg | 16.41 mg | 89.44 mg | from SR Legacy used | US food database (USDA SR Legacy) #168462 | C |
| Energy | 21.58 kcal | 18.34 kcal | – | FDC Energy (Atwater Specific Factors) used | US food database (USDA Foundation Foods) | – |
| 23 kcal | 19.55 kcal | – | from SR Legacy · not used | US food database (USDA SR Legacy) #168462 | C | |
| Omega-3: EPA + DHA | 0 g | 0 g | 0 g | from SR Legacy used | US food database (USDA SR Legacy) #168462 | C |
| Fat | 0.604 g | 0.51 g | 2.8 g | listed used | US food database (USDA Foundation Foods) #1999633 | C |
| 0.8 g | 0.68 g | 3.71 g | second database · not used | UK food tables (CoFID 2021) #13-572 | C | |
| Cholesterol | 0 mg | 0 mg | 0 mg | from SR Legacy used | US food database (USDA SR Legacy) #168462 | C |
| Fatty acids, total saturated | 0.063 g | 0.05 g | 0.29 g | from SR Legacy used | US food database (USDA SR Legacy) #168462 | C |
| Fibre | 1.588 g | 1.35 g | 7.36 g | listed used | US food database (USDA Foundation Foods) #1999633 | C |
| Folate | 113.4 µg | 96.39 µg | 525.49 µg | listed used | US food database (USDA Foundation Foods) #1999633 | C |
| 114 µg | 96.9 µg | 528.27 µg | second database · not used | UK food tables (CoFID 2021) #13-572 | C | |
| Iron | 1.054 mg | 0.9 mg | 4.88 mg | listed used | US food database (USDA Foundation Foods) #1999633 | C |
| 2.1 mg | 1.79 mg | 9.73 mg | second database · not used | UK food tables (CoFID 2021) #13-572 | C | |
| Magnesium | 92.96 mg | 79.02 mg | 430.78 mg | listed used | US food database (USDA Foundation Foods) #1999633 | C |
| 54 mg | 45.9 mg | 250.24 mg | second database · not used | UK food tables (CoFID 2021) #13-572 | C | |
| Niacin (B3, niacin equivalents) | 1.374 mg | 1.17 mg | 6.37 mg | listed used | Canadian Nutrient File 2026 #2213 | C |
| Phosphorus | 40.56 mg | 34.48 mg | 187.95 mg | listed used | US food database (USDA Foundation Foods) #1999633 | C |
| 45 mg | 38.25 mg | 208.53 mg | second database · not used | UK food tables (CoFID 2021) #13-572 | C | |
| Potassium | 459.7 mg | 390.75 mg | 2,130.24 mg | listed used | US food database (USDA Foundation Foods) #1999633 | C |
| 500 mg | 425 mg | 2,316.99 mg | second database · not used | UK food tables (CoFID 2021) #13-572 | C | |
| Protein | 2.906 g | 2.47 g | 13.47 g | listed used | US food database (USDA Foundation Foods) #1999633 | C |
| 2.8 g | 2.38 g | 12.98 g | second database · not used | UK food tables (CoFID 2021) #13-572 | C | |
| Riboflavin (B2) | 0.192 mg | 0.16 mg | 0.89 mg | listed used | US food database (USDA Foundation Foods) #1999633 | C |
| 0.09 mg | 0.08 mg | 0.42 mg | second database · not used · 2.1× | UK food tables (CoFID 2021) #13-572 | C | |
| Selenium | 0 µg | 0 µg | 0 µg | listed used | US food database (USDA Foundation Foods) #1999633 | C |
| 1 µg | 0.85 µg | 4.63 µg | second database · not used | UK food tables (CoFID 2021) #13-572 | C | |
| Sodium | 106.6 mg | 90.61 mg | 493.98 mg | listed used | US food database (USDA Foundation Foods) #1999633 | C |
| 140 mg | 119 mg | 648.76 mg | second database · not used | UK food tables (CoFID 2021) #13-572 | C | |
| Sugars | 0.42 g | 0.36 g | 1.95 g | from SR Legacy used | US food database (USDA SR Legacy) #168462 | C |
| 1.5 g | 1.28 g | 6.95 g | second database · not used · 3.6× | UK food tables (CoFID 2021) #13-572 | C | |
| Thiamin (B1) | 0.077 mg | 0.07 mg | 0.35 mg | listed used | US food database (USDA Foundation Foods) #1999633 | C |
| 0.07 mg | 0.06 mg | 0.32 mg | second database · not used | UK food tables (CoFID 2021) #13-572 | C | |
| Vitamin A | 306 µg | 260.1 µg | 1,418 µg | listed used | US food database (USDA Foundation Foods) #1999633 | C |
| Vitamin B12 | 0 µg | 0 µg | 0 µg | from SR Legacy used | US food database (USDA SR Legacy) #168462 | C |
| 0 µg | 0 µg | 0 µg | second database · not used | UK food tables (CoFID 2021) #13-572 | C | |
| Vitamin B6 | 0.214 mg | 0.18 mg | 0.99 mg | listed used | US food database (USDA Foundation Foods) #1999633 | C |
| 0.17 mg | 0.14 mg | 0.79 mg | second database · not used | UK food tables (CoFID 2021) #13-572 | C | |
| Vitamin C | 30.27 mg | 25.73 mg | 140.27 mg | listed used | US food database (USDA Foundation Foods) #1999633 | C |
| 26 mg | 22.1 mg | 120.48 mg | second database · not used | UK food tables (CoFID 2021) #13-572 | C | |
| Vitamin D | 0 µg | 0 µg | 0 µg | from SR Legacy used | US food database (USDA SR Legacy) #168462 | C |
| 0 µg | 0 µg | 0 µg | second database · not used | UK food tables (CoFID 2021) #13-572 | C | |
| Vitamin E | 2.03 mg | 1.73 mg | 9.41 mg | from SR Legacy used | US food database (USDA SR Legacy) #168462 | C |
| 1.71 mg | 1.45 mg | 7.92 mg | second database · not used | UK food tables (CoFID 2021) #13-572 | C | |
| Vitamin K1 | 482.9 µg | 410.47 µg | 2,237.75 µg | from SR Legacy used | US food database (USDA SR Legacy) #168462 | C |
| 394 µg | 334.9 µg | 1,825.79 µg | second database · not used | UK food tables (CoFID 2021) #13-572 | C | |
| Water | 92.43 g | 78.57 g | 428.32 g | listed used | US food database (USDA Foundation Foods) #1999633 | C |
| 89.7 g | 76.25 g | 415.67 g | second database · not used | UK food tables (CoFID 2021) #13-572 | C | |
| Zinc | 0.423 mg | 0.36 mg | 1.96 mg | listed used | US food database (USDA Foundation Foods) #1999633 | C |
| 0.7 mg | 0.6 mg | 3.24 mg | second database · not used | UK food tables (CoFID 2021) #13-572 | C |
| Nutrient | Per 100 g | Per serving | Per 100 calories | How | Source | Grade |
|---|---|---|---|---|---|---|
| Beta-carotene | 3,668.75 µg | 3,118.44 µg | 17,000.93 µg | listed used | US food database (USDA Foundation Foods) #1999633 | C |
| 8,295 µg | 7,050.75 µg | 38,438.91 µg | second database · not used · 2.3× | UK food tables (CoFID 2021) #13-572 | C | |
| Copper | 0.079 mg | 0.07 mg | 0.37 mg | listed used | US food database (USDA Foundation Foods) #1999633 | C |
| 0.04 mg | 0.03 mg | 0.19 mg | second database · not used | UK food tables (CoFID 2021) #13-572 | C | |
| Energy (Atwater general) | 27.63 kcal | 23.49 kcal | 128.04 kcal | listed used | US food database (USDA Foundation Foods) #1999633 | C |
| Energy (Atwater specific) | 21.58 kcal | 18.34 kcal | 100 kcal | listed used | US food database (USDA Foundation Foods) #1999633 | C |
| Nitrogen | 0.465 g | 0.4 g | 2.15 g | listed used | US food database (USDA Foundation Foods) #1999633 | C |
| Ash | 1.418 g | 1.21 g | 6.57 g | listed used | US food database (USDA Foundation Foods) #1999633 | C |
| Sucrose | 0.07 g | 0.06 g | 0.32 g | from SR Legacy used | US food database (USDA SR Legacy) #168462 | C |
| Glucose | 0.11 g | 0.09 g | 0.51 g | from SR Legacy used | US food database (USDA SR Legacy) #168462 | C |
| Fructose | 0.15 g | 0.13 g | 0.7 g | from SR Legacy used | US food database (USDA SR Legacy) #168462 | C |
| Maltose | 0 g | 0 g | 0 g | from SR Legacy used | US food database (USDA SR Legacy) #168462 | C |
| Alcohol, ethyl | 0 g | 0 g | 0 g | from SR Legacy used | US food database (USDA SR Legacy) #168462 | C |
| Caffeine | 0 mg | 0 mg | 0 mg | from SR Legacy used | US food database (USDA SR Legacy) #168462 | C |
| Theobromine | 0 mg | 0 mg | 0 mg | from SR Legacy used | US food database (USDA SR Legacy) #168462 | C |
| Energy | 97 kj | 82.45 kj | 449.5 kj | from SR Legacy used | US food database (USDA SR Legacy) #168462 | C |
| Galactose | 0.1 g | 0.09 g | 0.46 g | from SR Legacy used | US food database (USDA SR Legacy) #168462 | C |
| Vitamin A, IU | 9,377 iu | 7,970.45 iu | 43,452.88 iu | from SR Legacy used | US food database (USDA SR Legacy) #168462 | C |
| Carotene, alpha | 0 µg | 0 µg | 0 µg | listed used | US food database (USDA Foundation Foods) #1999633 | C |
| Vitamin D (D2 + D3), International Units | 0 iu | 0 iu | 0 iu | from SR Legacy used | US food database (USDA SR Legacy) #168462 | C |
| Carotene, gamma | 0 µg | 0 µg | 0 µg | listed used | US food database (USDA Foundation Foods) #1999633 | C |
| Zeaxanthin | 466.5 µg | 396.53 µg | 2,161.75 µg | listed used | US food database (USDA Foundation Foods) #1999633 | C |
| Cryptoxanthin, beta | 10 µg | 8.5 µg | 46.34 µg | listed used | US food database (USDA Foundation Foods) #1999633 | C |
| Lutein | 7,451 µg | 6,333.35 µg | 34,527.82 µg | listed used | US food database (USDA Foundation Foods) #1999633 | C |
| Lycopene | 0 µg | 0 µg | 0 µg | listed used | US food database (USDA Foundation Foods) #1999633 | C |
| Tocopherol, beta | 0 mg | 0 mg | 0 mg | from SR Legacy used | US food database (USDA SR Legacy) #168462 | C |
| Tocopherol, gamma | 0.18 mg | 0.15 mg | 0.83 mg | from SR Legacy used | US food database (USDA SR Legacy) #168462 | C |
| Tocopherol, delta | 0 mg | 0 mg | 0 mg | from SR Legacy used | US food database (USDA SR Legacy) #168462 | C |
| Tocotrienol, alpha | 0 mg | 0 mg | 0 mg | from SR Legacy used | US food database (USDA SR Legacy) #168462 | C |
| Tocotrienol, beta | 0 mg | 0 mg | 0 mg | from SR Legacy used | US food database (USDA SR Legacy) #168462 | C |
| Tocotrienol, gamma | 0 mg | 0 mg | 0 mg | from SR Legacy used | US food database (USDA SR Legacy) #168462 | C |
| Tocotrienol, delta | 0 mg | 0 mg | 0 mg | from SR Legacy used | US food database (USDA SR Legacy) #168462 | C |
| cis-Lutein/Zeaxanthin | 0 µg | 0 µg | 0 µg | listed used | US food database (USDA Foundation Foods) #1999633 | C |
| Biotin | 4.252 µg | 3.61 µg | 19.7 µg | listed used | US food database (USDA Foundation Foods) #1999633 | C |
| Folic acid | 0 µg | 0 µg | 0 µg | from SR Legacy used | US food database (USDA SR Legacy) #168462 | C |
| Folate, food | 194 µg | 164.9 µg | 898.99 µg | from SR Legacy used | US food database (USDA SR Legacy) #168462 | C |
| Folate, DFE | 194 µg | 164.9 µg | 898.99 µg | from SR Legacy used | US food database (USDA SR Legacy) #168462 | C |
| Betaine | 102.6 mg | 87.21 mg | 475.45 mg | from SR Legacy used | US food database (USDA SR Legacy) #168462 | C |
| Tryptophan | 0.039 g | 0.03 g | 0.18 g | from SR Legacy used | US food database (USDA SR Legacy) #168462 | C |
| Threonine | 0.122 g | 0.1 g | 0.57 g | from SR Legacy used | US food database (USDA SR Legacy) #168462 | C |
| Isoleucine | 0.147 g | 0.12 g | 0.68 g | from SR Legacy used | US food database (USDA SR Legacy) #168462 | C |
| Leucine | 0.223 g | 0.19 g | 1.03 g | from SR Legacy used | US food database (USDA SR Legacy) #168462 | C |
| Lysine | 0.174 g | 0.15 g | 0.81 g | from SR Legacy used | US food database (USDA SR Legacy) #168462 | C |
| Methionine | 0.053 g | 0.05 g | 0.25 g | from SR Legacy used | US food database (USDA SR Legacy) #168462 | C |
| Cystine | 0.035 g | 0.03 g | 0.16 g | from SR Legacy used | US food database (USDA SR Legacy) #168462 | C |
| Phenylalanine | 0.129 g | 0.11 g | 0.6 g | from SR Legacy used | US food database (USDA SR Legacy) #168462 | C |
| Tyrosine | 0.108 g | 0.09 g | 0.5 g | from SR Legacy used | US food database (USDA SR Legacy) #168462 | C |
| Valine | 0.161 g | 0.14 g | 0.75 g | from SR Legacy used | US food database (USDA SR Legacy) #168462 | C |
| Arginine | 0.162 g | 0.14 g | 0.75 g | from SR Legacy used | US food database (USDA SR Legacy) #168462 | C |
| Histidine | 0.064 g | 0.05 g | 0.3 g | from SR Legacy used | US food database (USDA SR Legacy) #168462 | C |
| Alanine | 0.142 g | 0.12 g | 0.66 g | from SR Legacy used | US food database (USDA SR Legacy) #168462 | C |
| Aspartic acid | 0.24 g | 0.2 g | 1.11 g | from SR Legacy used | US food database (USDA SR Legacy) #168462 | C |
| Glutamic acid | 0.343 g | 0.29 g | 1.59 g | from SR Legacy used | US food database (USDA SR Legacy) #168462 | C |
| Glycine | 0.134 g | 0.11 g | 0.62 g | from SR Legacy used | US food database (USDA SR Legacy) #168462 | C |
| Proline | 0.112 g | 0.1 g | 0.52 g | from SR Legacy used | US food database (USDA SR Legacy) #168462 | C |
| Serine | 0.104 g | 0.09 g | 0.48 g | from SR Legacy used | US food database (USDA SR Legacy) #168462 | C |
| Vitamin E, added | 0 mg | 0 mg | 0 mg | from SR Legacy used | US food database (USDA SR Legacy) #168462 | C |
| Vitamin B-12, added | 0 µg | 0 µg | 0 µg | from SR Legacy used | US food database (USDA SR Legacy) #168462 | C |
| Fatty acids, total trans | 0 g | 0 g | 0 g | from SR Legacy used | US food database (USDA SR Legacy) #168462 | C |
| SFA 4:0 | 0 g | 0 g | 0 g | from SR Legacy used | US food database (USDA SR Legacy) #168462 | C |
| SFA 6:0 | 0 g | 0 g | 0 g | from SR Legacy used | US food database (USDA SR Legacy) #168462 | C |
| SFA 8:0 | 0 g | 0 g | 0 g | from SR Legacy used | US food database (USDA SR Legacy) #168462 | C |
| SFA 10:0 | 0 g | 0 g | 0 g | from SR Legacy used | US food database (USDA SR Legacy) #168462 | C |
| SFA 12:0 | 0 g | 0 g | 0 g | from SR Legacy used | US food database (USDA SR Legacy) #168462 | C |
| SFA 14:0 | 0.01 g | 0.01 g | 0.05 g | from SR Legacy used | US food database (USDA SR Legacy) #168462 | C |
| SFA 16:0 | 0.049 g | 0.04 g | 0.23 g | from SR Legacy used | US food database (USDA SR Legacy) #168462 | C |
| SFA 18:0 | 0.004 g | 0 g | 0.02 g | from SR Legacy used | US food database (USDA SR Legacy) #168462 | C |
| MUFA 18:1 | 0.005 g | 0 g | 0.02 g | from SR Legacy used | US food database (USDA SR Legacy) #168462 | C |
| PUFA 18:2 | 0.026 g | 0.02 g | 0.12 g | from SR Legacy used | US food database (USDA SR Legacy) #168462 | C |
| PUFA 18:3 | 0.138 g | 0.12 g | 0.64 g | from SR Legacy used | US food database (USDA SR Legacy) #168462 | C |
| PUFA 20:4 | 0 g | 0 g | 0 g | from SR Legacy used | US food database (USDA SR Legacy) #168462 | C |
| PUFA 22:6 n-3 (DHA) | 0 g | 0 g | 0 g | from SR Legacy used | US food database (USDA SR Legacy) #168462 | C |
| MUFA 16:1 | 0.005 g | 0 g | 0.02 g | from SR Legacy used | US food database (USDA SR Legacy) #168462 | C |
| PUFA 18:4 | 0 g | 0 g | 0 g | from SR Legacy used | US food database (USDA SR Legacy) #168462 | C |
| MUFA 20:1 | 0 g | 0 g | 0 g | from SR Legacy used | US food database (USDA SR Legacy) #168462 | C |
| PUFA 20:5 n-3 (EPA) | 0 g | 0 g | 0 g | from SR Legacy used | US food database (USDA SR Legacy) #168462 | C |
| MUFA 22:1 | 0 g | 0 g | 0 g | from SR Legacy used | US food database (USDA SR Legacy) #168462 | C |
| PUFA 22:5 n-3 (DPA) | 0 g | 0 g | 0 g | from SR Legacy used | US food database (USDA SR Legacy) #168462 | C |
| Phytosterols | 9 mg | 7.65 mg | 41.71 mg | from SR Legacy used | US food database (USDA SR Legacy) #168462 | C |
| Fatty acids, total monounsaturated | 0.01 g | 0.01 g | 0.05 g | from SR Legacy used | US food database (USDA SR Legacy) #168462 | C |
| Fatty acids, total polyunsaturated | 0.165 g | 0.14 g | 0.76 g | from SR Legacy used | US food database (USDA SR Legacy) #168462 | C |
| Cryptoxanthin, alpha | 0 µg | 0 µg | 0 µg | listed used | US food database (USDA Foundation Foods) #1999633 | C |
| Iodine | 6.7 µg | 5.7 µg | 31.05 µg | listed used | USDA iodine database (2024) #Spinach, raw | C |
| 2 µg | 1.7 µg | 9.27 µg | second database · not used · 3.4× | UK food tables (CoFID 2021) #13-572 | C | |
| 6.088 µg | 5.17 µg | 28.21 µg | second database · not used | US food database (USDA Foundation Foods) #1999633 | C | |
| Lactose | 0 g | 0 g | 0 g | from SR Legacy used | US food database (USDA SR Legacy) #168462 | C |
| 0 g | 0 g | 0 g | second database · not used | UK food tables (CoFID 2021) #13-572 | C | |
| Lutein + zeaxanthin | 7,917.5 µg | 6,729.88 µg | 36,689.58 µg | listed used | US food database (USDA Foundation Foods) #1999633 | C |
| Manganese | 0.426 mg | 0.36 mg | 1.97 mg | listed used | US food database (USDA Foundation Foods) #1999633 | C |
| 0.6 mg | 0.51 mg | 2.78 mg | second database · not used | UK food tables (CoFID 2021) #13-572 | C | |
| Niacin (B3, preformed) | 0.51 mg | 0.43 mg | 2.36 mg | listed used | US food database (USDA Foundation Foods) #1999633 | C |
| 1.2 mg | 1.02 mg | 5.56 mg | second database · not used · 2.4× | UK food tables (CoFID 2021) #13-572 | C | |
| Pantothenic acid (B5) | 0.065 mg | 0.06 mg | 0.3 mg | from SR Legacy used | US food database (USDA SR Legacy) #168462 | C |
| 0.27 mg | 0.23 mg | 1.25 mg | second database · not used · 4.2× | UK food tables (CoFID 2021) #13-572 | C | |
| Retinol | 0 µg | 0 µg | 0 µg | from SR Legacy used | US food database (USDA SR Legacy) #168462 | C |
| 0 µg | 0 µg | 0 µg | second database · not used | UK food tables (CoFID 2021) #13-572 | C |
Change the amount to rescale the first column. Nutrients a database doesn't list are missing, not zero.
Absorption studies
Studies of how much of a nutrient gets in; those done in animals are marked. This page quotes a figure only from a study that passes our screen: adults, graded A, of this food in this preparation, with a test dose on record and a source that has passed our evidence check. The exception is calcium on our calcium card: its figure comes from the card’s own study, checked with the card, and is marked “used” even where that study misses a step of this screen. The others are listed so nothing is hidden, each with the first check it fails.
| Study | Nutrient | Absorbed | Test dose | People | Grade | On this page |
|---|---|---|---|---|---|---|
| Heaney, Weaver & Recker 1988: spinach standard · not stated in the abstract abstract only | Calcium | 5.1 % | 200 mg | 13 | A | Used |
| Study | Nutrient | Absorbed | Test dose | People | Grade | On this page |
|---|---|---|---|---|---|---|
| Weaver & Heaney 1991: spinach (intrinsic) standard · not stated abstract only | Calcium | 2.9 % | 250 mg | 14 | A | Not used: we haven’t confirmed how the food was prepared in this study. |
| Grusak & Abrams: spinach (teens) standard · cooked, puréed, frozen · load not reported abstract only | Calcium | 3 % | not reported | 13 | A | Not used: we haven’t confirmed how the food was prepared in this study. |
| Rezaei et al. 2026: spinach alone (sub-study, n=5) Platypus RZ F1, hydroponic, 30 atom% D2O · spinach chopped, microwaved 30 s, vacuum-sealed, frozen at -20 C; thawed and microwaved 60 s before eating · 118 +/- 7.5 g (mean +/- SEM; range 94-134 g) of labelled spinach per trial, delivering 5 mg d x-alpha-tocopherol (design value; per-trial analysed mg not reported) full text read | Vitamin E | 2 % | not reported | 5 | A | Not used: no test dose on record. |
| Dainty et al. 2007: spinach, urinary excretion method Spinacia oleracea var. Ballet, hydroponic, 15N-labelled (intrinsic label) · spinach finely chopped, heated about 2 min to about 60 C in the soup, blended with milk, served at about 85 C · 308 ug 15N-labelled total flavins (free riboflavin + FMN) from the spinach (0.86 ug riboflavin + 0.68 ug FMN per g raw spinach); plus 334 ug unlabelled riboflavin from the soup's milk full text read | Riboflavin (B2) | 60 % | not reported | 17 | A | Not used: no test dose on record. |
| Dainty et al. 2007: spinach, plasma appearance method Spinacia oleracea var. Ballet, hydroponic, 15N-labelled (intrinsic label) · spinach finely chopped, heated about 2 min to about 60 C in the soup, blended with milk, served at about 85 C · 308 ug 15N-labelled total flavins (free riboflavin + FMN) from the spinach (0.86 ug riboflavin + 0.68 ug FMN per g raw spinach); plus 334 ug unlabelled riboflavin from the soup's milk full text read | Riboflavin (B2) | 20 % | not reported | 15 | A | Not used: no test dose on record. |
| Bills 1990: spinach not stated · frozen chopped spinach, microwaved 2 min · 0.5 mg pyridoxine-equivalent of B6 (microbiological assay) = 215 g frozen chopped spinach at 0.230 mg B6/100 g full text read | Vitamin B6 | – | not reported | 7 | B | Not used: it measures something other than the share absorbed. |
| Hannon-Fletcher et al. 2004: spinach not stated · lyophilised (freeze-dried) spinach powder, 7.8 g = 200 ug folate (50% polyglutamyl), added after cooking to a low-folate carrier meal (ingredients boiled 3 times) or stirred into 20 mL water + 50 mL sugar-free lemonade (drink); the spinach itself was not cooked or fresh · 200 ug natural folate/day as 7.8 g lyophilised spinach, 5 d/week over 6 weeks (30 d of treatment); folic acid arm 200 ug tablet full text read | Folate | – | not reported | 18 | A | Not used: it measures something other than the share absorbed. |
| Konings et al. 2002: spinach, fraction absorbed (ileostomy volunteers) not stated · spinach meal; preparation not stated · A 436 ug spinach folate (60% polyglutamate); B 362 ug (100% monoglutamate); reference C 500 ug PteGlu (loads as given in the Melse-Boonstra thesis appendix) abstract only | Folate | 79 % | not reported | 11 | A | Not used: we haven’t confirmed how the food was prepared in this study. |
| Konings et al. 2002: spinach, relative bioavailability vs PteGlu not stated · spinach meal; preparation not stated · A 436 ug spinach folate (60% polyglutamate); B 362 ug (100% monoglutamate); reference C 500 ug PteGlu (loads as given in the Melse-Boonstra thesis appendix) abstract only | Folate | – | not reported | 11 | A | Not used: it measures something other than the share absorbed. |
| Wright et al. 2005: spinach not stated · intrinsically 15N-labelled spinach (hydroponic, 8 weeks): leaves shredded, 200 g portions blanched in microwave 750 W 3 min, cooled, frozen -20 C; thawed, homogenised and reheated by microwave before serving · 588 nmol spinach folate (about 260 ug; 2.94 umol/kg x ~200 g portion) full text read | Folate | 44 % | not reported | 14 | A | Not used: no test dose on record. |
| Prinz-Langenohl et al. 1999: spinach, 600 g not stated · commercial frozen leaf spinach (Langnese-Iglo), thawed overnight at 4 C, microwaved at 600 W without added water (8 min for 600 g, 6 min for 300 g); meal prepared just before consumption, taken fasting · 600 g spinach; folate content from the package label 80 ug/100 g, i.e. about 480 ug full text read | Folate | – | not reported | 20 | A | Not used: it measures something other than the share absorbed. |
| Prinz-Langenohl et al. 1999: spinach, 300 g not stated · commercial frozen leaf spinach (Langnese-Iglo), thawed overnight at 4 C, microwaved at 600 W without added water (8 min for 600 g, 6 min for 300 g); meal prepared just before consumption, taken fasting · 300 g spinach (about 240 ug by package label 80 ug/100 g) full text read | Folate | – | not reported | 20 | A | Not used: it measures something other than the share absorbed. |
| Monch et al. 2015: spinach not stated · not stated · load not reported abstract only | Folate | – | not reported | 24 | B | Not used: it measures something other than the share absorbed. |
| Gillooly et al. 1983: spinach not stated · boiled 20 min in salted water (750 g vegetable in 1500 ml water with 5 g NaCl; lentils 40 min in 2500 ml), homogenised in a Waring blender to a thick soup; 100 g eaten (equivalent to 50 g uncooked vegetable) · 3 mg Fe as FeSO4.7H2O (59Fe or 55Fe) mixed into 100 g puree; native iron of the vegetable not reported full text read | Iron | 1.4 % | not reported | 7 | A | Not used: no test dose on record. |
| Bohn et al. 2004: spinach not stated (bought frozen at a local supermarket) · frozen spinach, cooked, pureed, microwave-reheated · 121 mg (4.98 mmol total Mg in the meal) full text read | Magnesium | 26.7 % | not reported | 9 | A | Not used: we haven’t confirmed how the food was prepared in this study. |
| Rezaei et al. 2026: spinach + 1 egg at time 0 (sub-study, n=5) Platypus RZ F1, hydroponic, 30 atom% D2O · spinach chopped, microwaved 30 s, vacuum-sealed, frozen at -20 C; thawed and microwaved 60 s before eating · 118 +/- 7.5 g (mean +/- SEM; range 94-134 g) of labelled spinach per trial, delivering 5 mg d x-alpha-tocopherol (design value; per-trial analysed mg not reported) full text read | Vitamin E | 4.5 % | not reported | 5 | A | Not used: no test dose on record. |
| Gijsbers et al. 1996: spinach, without butter not stated · commercially prepared deep-frozen shredded spinach (Iglo), heated without additions until boiling under constant stirring (boiled from frozen) · 1 mg (2.2 umol) phylloquinone from 227 g boiled spinach (9.8 nmol/g) full text read | Vitamin K1 | – | not reported | 5 | A | Not used: it measures something other than the share absorbed. |
| Tang et al. 2005: spinach not stated · puréed; cooking not stated · 300 g spinach = 20.8 umol (men) or 20.0 umol (women) trans-beta-carotene equivalents (about 10.7 to 11.2 mg) abstract only | Vitamin A | – | not reported | 14 | A | Not used: it measures something other than the share absorbed. |
| Castenmiller et al. 1999: spinach four processing variants · whole leaf with an almost intact matrix; minced; enzymatically liquefied; liquefied + 10 g/kg fibre · daily dose not stated abstract only | Beta-carotene | – | not reported | 12 | A | Not used: it measures something other than the share absorbed. |
| Wang et al. 2007: spinach not stated · steamed · 100 g steamed spinach = 7.0 umol beta-carotene (about 3.8 mg) abstract only | Vitamin A | – | not reported | 10 | A | Not used: it measures something other than the share absorbed. |
| Li et al. 2007: spinach not stated · not stated · 5 g spinach (230 ug 2H10-beta-carotene) before lunch and before dinner for 7 d abstract only | Vitamin A | – | not reported | 32 | A | Not used: it measures something other than the share absorbed. |
| Rezaei et al. 2026: spinach, then 1 egg 3 h later (sub-study, n=5) Platypus RZ F1, hydroponic, 30 atom% D2O · spinach chopped, microwaved 30 s, vacuum-sealed, frozen at -20 C; thawed and microwaved 60 s before eating · 118 +/- 7.5 g (mean +/- SEM; range 94-134 g) of labelled spinach per trial, delivering 5 mg d x-alpha-tocopherol (design value; per-trial analysed mg not reported) full text read | Vitamin E | 1.6 % | not reported | 5 | A | Not used: no test dose on record. |
| Rezaei et al. 2026: spinach + 1 egg at 0 h and a second at 3 h (sub-study, n=5) Platypus RZ F1, hydroponic, 30 atom% D2O · spinach chopped, microwaved 30 s, vacuum-sealed, frozen at -20 C; thawed and microwaved 60 s before eating · 118 +/- 7.5 g (mean +/- SEM; range 94-134 g) of labelled spinach per trial, delivering 5 mg d x-alpha-tocopherol (design value; per-trial analysed mg not reported) full text read | Vitamin E | 4.7 % | not reported | 5 | A | Not used: no test dose on record. |
| Rezaei et al. 2026: spinach alone Platypus RZ F1, hydroponic, 30 atom% D2O · spinach chopped, microwaved 30 s, vacuum-sealed, frozen at -20 C; thawed and microwaved 60 s before eating · 118 +/- 7.5 g (mean +/- SEM; range 94-134 g) of labelled spinach per trial, delivering 5 mg d x-alpha-tocopherol (design value; per-trial analysed mg not reported) full text read | Vitamin E | 2.4 % | not reported | 8 | A | Not used: no test dose on record. |
| Rezaei et al. 2026: spinach + 1 hard-boiled whole egg Platypus RZ F1, hydroponic, 30 atom% D2O · spinach chopped, microwaved 30 s, vacuum-sealed, frozen at -20 C; thawed and microwaved 60 s before eating · 118 +/- 7.5 g (mean +/- SEM; range 94-134 g) of labelled spinach per trial, delivering 5 mg d x-alpha-tocopherol (design value; per-trial analysed mg not reported) full text read | Vitamin E | 4.9 % | not reported | 8 | A | Not used: no test dose on record. |
| Rezaei et al. 2026: spinach + 2 hard-boiled whole eggs Platypus RZ F1, hydroponic, 30 atom% D2O · spinach chopped, microwaved 30 s, vacuum-sealed, frozen at -20 C; thawed and microwaved 60 s before eating · 118 +/- 7.5 g (mean +/- SEM; range 94-134 g) of labelled spinach per trial, delivering 5 mg d x-alpha-tocopherol (design value; per-trial analysed mg not reported) full text read | Vitamin E | 4 % | not reported | 8 | A | Not used: no test dose on record. |
| Rezaei et al. 2026: spinach + 3 hard-boiled whole eggs Platypus RZ F1, hydroponic, 30 atom% D2O · spinach chopped, microwaved 30 s, vacuum-sealed, frozen at -20 C; thawed and microwaved 60 s before eating · 118 +/- 7.5 g (mean +/- SEM; range 94-134 g) of labelled spinach per trial, delivering 5 mg d x-alpha-tocopherol (design value; per-trial analysed mg not reported) full text read | Vitamin E | 4.4 % | not reported | 8 | A | Not used: no test dose on record. |
| Rezaei et al. 2026: spinach + 2 egg whites Platypus RZ F1, hydroponic, 30 atom% D2O · spinach chopped, microwaved 30 s, vacuum-sealed, frozen at -20 C; thawed and microwaved 60 s before eating · 118 +/- 7.5 g (mean +/- SEM; range 94-134 g) of labelled spinach per trial, delivering 5 mg d x-alpha-tocopherol (design value; per-trial analysed mg not reported) full text read | Vitamin E | 4.1 % | not reported | 8 | A | Not used: no test dose on record. |
| Rezaei et al. 2026: spinach + 9.6 g soybean oil Platypus RZ F1, hydroponic, 30 atom% D2O · spinach chopped, microwaved 30 s, vacuum-sealed, frozen at -20 C; thawed and microwaved 60 s before eating · 118 +/- 7.5 g (mean +/- SEM; range 94-134 g) of labelled spinach per trial, delivering 5 mg d x-alpha-tocopherol (design value; per-trial analysed mg not reported) full text read | Vitamin E | 4.9 % | not reported | 8 | A | Not used: no test dose on record. |
| Gijsbers et al. 1996: spinach, with 25 g butter not stated · deep-frozen shredded spinach (Iglo) heated to boiling, served with 25 g butter · 1 mg (2.2 umol) phylloquinone from 227 g boiled spinach plus 25 g butter full text read | Vitamin K1 | – | not reported | 5 | A | Not used: it measures something other than the share absorbed. |
| Garber et al. 1999: spinach, 150 g not stated · fresh spinach from a local market, washed, stems removed (raw) · 495 ug phylloquinone as 150 g fresh spinach; tablet 500 ug full text read | Vitamin K1 | – | not reported | 3 | A | Not used: it measures something other than the share absorbed. |
| Garber et al. 1999: spinach, 50 g not stated · fresh spinach (raw) · 165 ug phylloquinone as 50 g fresh spinach; tablet 500 ug full text read | Vitamin K1 | – | not reported | 4 | A | Not used: it measures something other than the share absorbed. |
Hazard rows as the dataset rates them
- Cadmium · Go easy: can push past the limit · A daily serving adds 52% to an average adult's cadmium intake (EFSA 2012 adult median, 1.77 µg/kg body weight/week; Canadian adults in 2007: 1.2-1.75), short of doubling it, so no cap. · Health Canada Total Diet Study, trace elements · A
- Lead · Nothing to watch: doesn’t double average intake · adds 2.9% to average intake · Health Canada Total Diet Study, trace elements · A
- Nitrate · Context · Context only: 35% of the acceptable daily intake (ADI) per serving · EFSA 2008 · A
- Uncooked frozen vegetables · Worth knowing · Don't eat frozen spinach uncooked if pregnant, 60+, under 5 or immunocompromised · Health Canada, Food safety for vulnerable populations: foods to avoid · A
- Vitamin K and warfarin · Worth knowing · With warfarin: keep vitamin K intake consistent · Warfarin product label · A
Oxalate, phytate and gut-tolerance measurements
- fodmap excess fructose: 0.04 g/100 g · fresh weight; computed as fructose minus glucose · raw · grade B · US food database (USDA SR Legacy)
- fodmap fructan: 0.14 g/100 g sample · as analysed (frozen retail product; cooking before analysis not stated); reported in the 'FOS' column · frozen retail product; whether it was cooked before analysis is not stated · grade B · Chumpitazi 2018
- fodmap gos: not detected (n duplicate) g/100 g sample · as analysed · frozen retail product; whether it was cooked before analysis is not stated · grade B · Chumpitazi 2018
- histamine: standard deviation 17.02, range 9.46–69.71, n = 18 mg/kg · as sold · raw · grade A · Sanchezperez 2018
- histamine: mean 31.77 · standard deviation 17.02 · range 9.46–69.72 · 0% below the detection limit · n 18 mg/kg · fresh weight · spinach, as sold in Spanish retail (fresh vs frozen and raw vs cooked not stated) · grade B · Sanchezperez 2021
- histamine: 9.5–69.7 mg/kg · fresh weight · spinach, as sold in Spanish retail · grade B · Sanchezperez 2018
- histamine: mean 142 · standard deviation 6 mg/kg · DRY MATTER (not fresh weight; no conversion made) · raw spinach (the raw control of a cooking experiment; Spanish retail purchase) · grade A · Munozesparza 2021
- oxalate soluble: 413–504 mg/100 g · fresh weight · raw · grade A · Brogren 2003
- oxalate total: 557–1800 mg/100 g · fresh weight · raw (across studies) · grade A · Brogren 2003
- tyramine: mean 2.05 · standard deviation 0.83 · range 0.79–4.28 · 0% below the detection limit · n 18 mg/kg · fresh weight · spinach, as sold in Spanish retail (fresh vs frozen and raw vs cooked not stated) · grade B · Sanchezperez 2021
Sources
- Bohn T, Davidsson L, Walczyk T, Hurrell RF. Fractional magnesium absorption is significantly lower in human subjects from a meal served with an oxalate-rich vegetable, spinach, as compared with a meal served with kale. Br J Nutr 2004;91(4):601-606. · doi:10.1079/BJN20031081 · PMID 15035687
bohn2004bjn· full text read · publisher copyright; <=30-word quotes only - Brogren M, Savage GP 2003 (spinach oxalate)
brogren2003· abstract only · Publisher copyright (journal article) - Chumpitazi BP, Lim J, McMeans AR, Shulman RJ, Hamaker BR. Evaluation of FODMAP carbohydrates content in selected foods in the United States. J Pediatr 2018 (author manuscript PMC6063767). · doi:10.1016/j.jpeds.2018.03.038 · PMID 29706489
chumpitazi2018· full text read · NIH author manuscript (PMC) - Health Canada, Canadian Nutrient File 2026 (14th edition)
cnf-2026· dataset · Open Government Licence – Canada 2.0 - Public Health England, Composition of Foods Integrated Dataset (CoFID) 2021
cofid-2021· dataset · Open Government Licence v3.0 - Monch S et al. Folate bioavailability from foods rich in folates assessed in a short term human study using stable isotope dilution assays. Food Funct 2015;6:241-7. · doi:10.1039/c4fo00658e · PMID 25407846
doi:10.1039/c4fo00658e· full text read · publisher; abstract read only - Gillooly M, Bothwell TH, Torrance JD, MacPhail AP, Derman DP, Bezwoda WR, et al. (1983). The effects of organic acids, phytates and polyphenols on the absorption of iron from vegetables. Br J Nutr 49:331-42 · doi:10.1079/bjn19830042 · PMID 6860621
doi:10.1079/bjn19830042· full text read · licence not recorded - EFSA CONTAM Panel (2008) Nitrate in vegetables. EFSA Journal 689 · doi:10.2903/j.efsa.2008.689
efsa-2008-nitrate· full text read · EFSA Journal: CC BY-ND 4.0 - USDA FoodData Central, Foundation Foods, release 2026-04-30
fdc-foundation-2026-04-30· dataset · CC0 1.0 (public domain) - USDA FoodData Central, SR Legacy, 2018-04
fdc-sr-legacy-2018-04· dataset · CC0 1.0 (public domain) - Health Canada, Canadian Total Diet Study – Trace Elements (2005–2018 composites)
hc-tds-trace-elements· dataset · Open Government Licence – Canada 2.0 - Health Canada, Food safety for vulnerable populations: foods to avoid (uncooked frozen vegetables)
hc-vulnerable-foods· page · Government of Canada terms (Crown copyright; not OGL) - Munoz-Esparza NC, Costa-Catala J, Comas-Baste O, Latorre-Moratalla ML, Vidal-Carou MC. Occurrence of polyamines in foods and the influence of cooking processes. Foods 2021;10(8):1752. · doi:10.3390/foods10081752 · PMID 34441529
munozesparza2021· full text read · CC BY 4.0 - Bills ND (1990). In vivo and in vitro determination of the bioavailability of vitamin B-6 from plant foods containing pyridoxine glucoside. PhD thesis, Oregon State University (advisor JE Leklem).
osu:bills1990· full text read · ScholarsArchive@OSU (open PDF; rights not evaluated) - Castenmiller JJ, West CE, Linssen JP, van het Hof KH, Voragen AG. The food matrix of spinach is a limiting factor in determining the bioavailability of beta-carotene and to a lesser extent of lutein in humans. J Nutr 1999;129:349-55. · doi:10.1093/jn/129.2.349 · PMID 10024612
pmid:10024612· abstract only · publisher; abstract quoted - Prinz-Langenohl R et al. Availability of food folate in humans. J Nutr 1999;129:913-6. · doi:10.1093/jn/129.4.913 · PMID 10203570
pmid:10203570· abstract only · publisher; abstract read only - Garber AK, Binkley NC, Krueger DC, Suttie JW. Comparison of phylloquinone bioavailability from food sources or a supplement in human subjects. J Nutr 1999;129:1201-1203. · doi:10.1093/jn/129.6.1201 · PMID 10356087
pmid:10356087· full text read · licence not recorded - Konings EJ et al. Intestinal absorption of different types of folate in healthy subjects with an ileostomy. Br J Nutr 2002;88:235-42. · doi:10.1079/bjn2002613 · PMID 12207833
pmid:12207833· abstract only · publisher; abstract read only - Hannon-Fletcher MP et al. Determining bioavailability of food folates in a controlled intervention study. Am J Clin Nutr 2004;80:911-8. · doi:10.1093/ajcn/80.4.911 · PMID 15447898
pmid:15447898· full text read · publisher; abstract read only - Wright AJ et al. Differential kinetic behavior and distribution for pteroylglutamic acid and reduced folates. J Nutr 2005;135:619-23. · doi:10.1093/jn/135.3.619 · PMID 15735104
pmid:15735104· abstract only · publisher; abstract read only - Tang G, Qin J, Dolnikowski GG, Russell RM, Grusak MA. Spinach or carrots can supply significant amounts of vitamin A as assessed by feeding with intrinsically deuterated vegetables. Am J Clin Nutr 2005;82:821-8. · doi:10.1093/ajcn/82.4.821 · PMID 16210712
pmid:16210712· abstract only · publisher; abstract quoted - Dainty JR, Bullock NR, Hart DJ, Hewson AT, Turner R, Finglas PM, Powers HJ (2007). Quantification of the bioavailability of riboflavin from foods by use of stable-isotope labels and kinetic modeling. Am J Clin Nutr 85(6):1557-1564. · doi:10.1093/ajcn/85.6.1557 · PMID 17556693
pmid:17556693· full text read · Publisher (open after embargo) - Weaver CM, Heaney RP. Isotopic exchange of ingested calcium between labeled sources. Evidence that ingested calcium does not form a common absorptive pool. Calcif Tissue Int 1991;49:244–7 · doi:10.1007/bf02556212 · PMID 1760767
pmid:1760767· abstract only · Publisher copyright (journal article) - Wang J, Wang Z, Wang Y, Fu Y. Vitamin A equivalence of spinach beta-carotene in human body (in Chinese). Wei Sheng Yan Jiu 2007;36:449-453 · PMID 17953213
pmid:17953213· abstract only · licence not recorded - Li L, Wang Y, Wu J, Zhu R. Bioefficacy of plant carotenoid to vitamin A in school age children (in Chinese). Wei Sheng Yan Jiu 2007;36:547-551 · PMID 18095563
pmid:18095563· abstract only · licence not recorded - Heaney RP, Weaver CM, Recker RR. Calcium absorbability from spinach. Am J Clin Nutr 1988;47:707–9 · doi:10.1093/ajcn/47.4.707 · PMID 3354496
pmid:3354496· abstract only · Publisher copyright (journal article) - Rezaei S, Cao S, Zeng M, et al. Co-ingestion timing, rather than food matrix or dose, determines alpha-tocopherol bioavailability from intrinsically labeled spinach in healthy adults: a crossover pharmacokinetic study. Antioxidants (Basel) 2026;15(9):1076. · doi:10.3390/antiox15091076 · PMID 42792114
pmid:42792114· full text read · CC BY 4.0 - Gijsbers BLMG, Jie KSG, Vermeer C. Effect of food composition on vitamin K absorption in human volunteers. Br J Nutr 1996;76:223-229. · doi:10.1079/bjn19960027 · PMID 8813897
pmid:8813897· full text read · licence not recorded - Sánchez-Pérez S et al. 2018, Foods 7:205, Table 1 (histamine in plant foods; PMC6306728)
sanchezperez2018· full text read · CC BY 4.0 - Sánchez-Pérez S et al. 2021, Nutrients 13:1395, Table 1 (histamine)
sanchezperez2021· full text read · CC BY 4.0 - Siener R. Nutrition and kidney stone disease. Nutrients 2021;13(6):1917 (secondary table; sesame value attributed to Hönow & Hesse 2002, Food Chem 78:511-521) · doi:10.3390/nu13061917
siener2021-kidney-stones· full text read · CC BY 4.0 (MDPI; not checked on the page) - Grusak MA, Abrams SA. USDA-ARS research record seqNo115=73011 (green beans and spinach in adolescents)
usda-ars-grusak-abrams· abstract only · US government record (USDA ARS), public domain - USDA, FDA and ODS-NIH Database for the Iodine Content of Common Foods, Release 4.0 (October 2024; 478 foods). Prepared by Heydorn K, Wambogo E, Spungen JH, Ershow AG, Gahche JJ, Haggans C, Merkel J, Patterson KY, Pehrsson PR. USDA ARS Methods and Application of Food Composition Laboratory.
usda-iodine-db4· secondary source · US Government work (public domain; USDA ARS) - Warfarin product monograph / label: keep vitamin K intake consistent
warfarin-label· page · Product label (manufacturer copyright)
Body map 2026-10-25.1: each nutrient’s job comes from an agency fact sheet, linked beside it under Good for.
The plain words: “a lot” means one serving (100 g when the food has no serving size) gives at least 20% of the daily amount (the reference intake), “some” at least 10%, “a little” at least 2% (the cut-offs are ours, one set for every page: 20% and 10% are borrowed from the US labelling terms “high” and “good source” and applied to Health Canada’s daily amount, whereas Health Canada’s own shopper rule says 15%; provisional: they may change in a later method version). The daily amount is Health Canada’s Dietary Reference Intake for adults 19–30; where men and women need different amounts we use the higher one (protein: 56 g for men, 46 g for women). The percentage printed under each nutrient is the printed amount as a share of that daily amount, rounded to the nearest whole number, and the word is read from that percentage, so the amount, the percentage and the word always agree. Calcium with a measured absorption is scaled by how well it gets in compared with milk.
The scale: “Nothing to watch” means a serving a day stays under the limit at ordinary amounts; “Go easy” means a serving a day can push past the limit for adults who already take in the most, or fewer than 2 servings reach it; “Limit it” means once a week or less. The dataset’s own rating is under “How we got this”. Provisional: the scale may change in a later method version.
Measured absorption under Good for: grade-A studies in adults that tested this preparation of this food, as a share of the listed amount (the share digested, for protein), quoted once each source has passed our evidence check; animal studies and other variants stay in the table above. Provisional: this screen may change in a later method version.