FoodtopsyFrançais

Vitamin C, food by food

Ranking · Vitamin C

Your body makes collagen with it, which wounds need to heal. It also helps you absorb iron from plants.

An adult is advised to get about 90 mg a day if a man, 75 mg if a woman. The words below are read against 90 mg, the men’s amount.

How we counted this

Health Canada’s Dietary Reference Intakes, adults 19–30. The word beside each food says how much of that one serving gives, read against the higher amount, 90 mg, which is the men’s: for the other sex a serving counts for more.

The plain words beside each food: “a lot” means one serving gives at least 20% of the daily amount, “some” at least 10%, “a little” at least 2%; below that it says “almost none”. Each row prints its percentage of the daily amount, rounded to a whole number, and the word is read from that printed percentage (a row at 9.6% prints 10% and reads “some”). The cut-offs are ours, one set for every page: 20% and 10% are borrowed from the US labelling terms “high” and “good source”, and applied to Health Canada’s daily amount; Health Canada’s own shopper rule says 15%, and we keep one number so a percentage never changes meaning (provisional: they may change in a later method version).

What it does: NIH Office of Dietary Supplements, vitamin C fact sheet for health professionals. How much a day: Health Canada, Dietary reference intakes tables: Reference values for vitamins.

Vitamin C also improves your body’s absorption of non-heme iron, the form of iron in plant-based foods. Iron, food by food, with the plant foods marked.

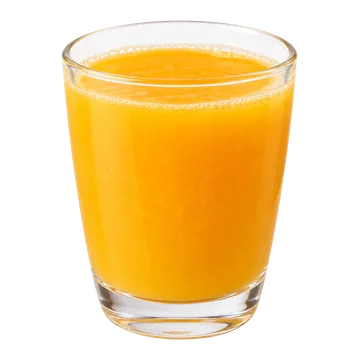
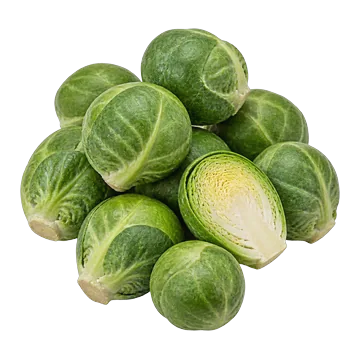
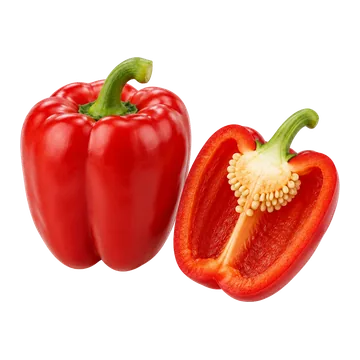
Most per serving: Orange juice (131 mg), then raw Brussels sprouts and Red pepper, raw.

Listed amounts, not what your body absorbs. Where a human study measured absorption, the food’s page shows it.

How we counted this

Listed for 190 of the 198 preparations on this page (150 foods). The other 8 aren’t zero, just not listed: see “Not listed” below.

188 of them are ranked below, by what one serving gives; the other 2 list it but have no serving size on file, so they follow, per 100 g.

The 159 reviewed foods (229 preparations) are counted here, and raw and cooked spinach are two preparations of one food. Each row below is one preparation, and 198 of them are on this page. The other 31 are left out: 19 raw or dry forms of a food ranked as eaten (listed below) and 12 fortified foods. Imported foods are listed separately below, not ranked. Every amount here is copied from the national food databases, as published. A serving’s weight is shown rounded, and the amount is worked from its exact weight, so a row can differ slightly from weight times the per-100 g figure.

  1. 1
    Orange juice
    262 g · US food database (USDA SR Legacy)
    146% of the men’s 90 mg
    A lot
    131mg
    50 mg / 100 g
  2. 2
    Brussels sprouts, raw
    85 g · US food database (USDA Foundation Foods)
    134% of the men’s 90 mg
    A lot
    121mg
    142.9 mg / 100 g
  3. 3
    Red pepper, raw
    85 g · US food database (USDA SR Legacy)
    121% of the men’s 90 mg
    A lot
    109mg
    127.7 mg / 100 g
  4. 4
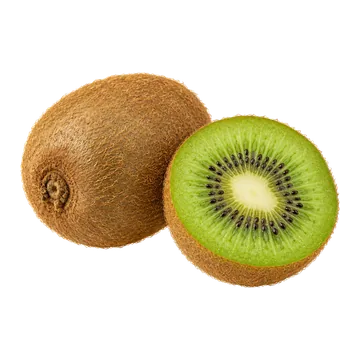
    Kiwi, raw
    140 g · US food database (USDA Foundation Foods)
    117% of the men’s 90 mg
    A lot
    105mg
    74.7 mg / 100 g
  5. 5
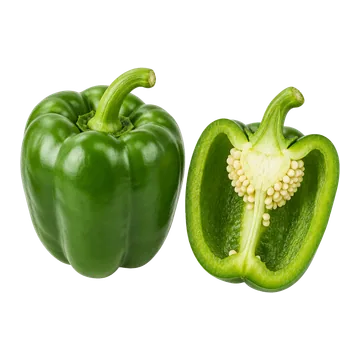
    Green pepper, raw
    85 g · US food database (USDA Foundation Foods)
    94% of the men’s 90 mg
    A lot
    84.6mg
    99.51 mg / 100 g
  6. 6
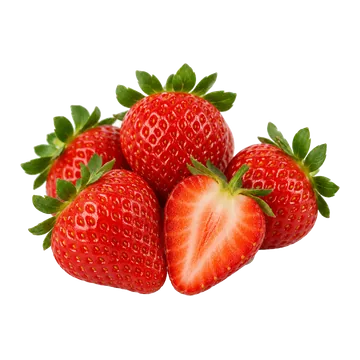
    Strawberries, raw
    140 g · US food database (USDA Foundation Foods)
    93% of the men’s 90 mg
    A lot
    83.5mg
    59.62 mg / 100 g
  7. 7
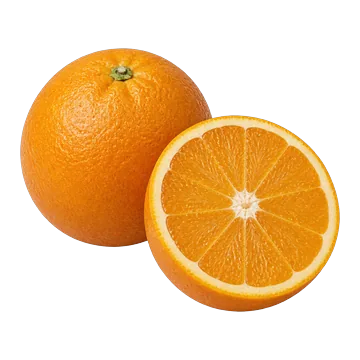
    Oranges, raw
    140 g · US food database (USDA Foundation Foods)
    92% of the men’s 90 mg
    A lot
    82.7mg
    59.1 mg / 100 g
  8. 8
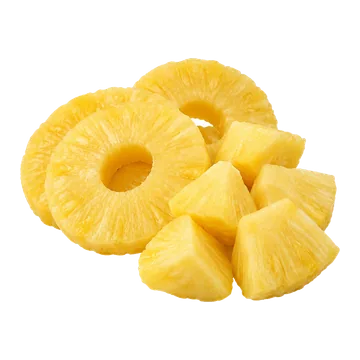
    Pineapple, raw
    140 g · US food database (USDA Foundation Foods)
    91% of the men’s 90 mg
    A lot
    82.1mg
    58.61 mg / 100 g
  9. 9
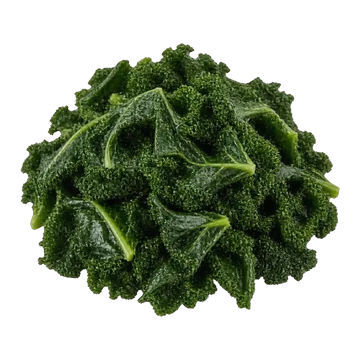
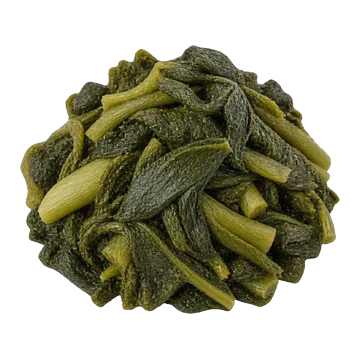
    Kale, raw
    85 g · US food database (USDA SR Legacy)
    88% of the men’s 90 mg
    A lot
    79.4mg
    93.4 mg / 100 g
  10. 10
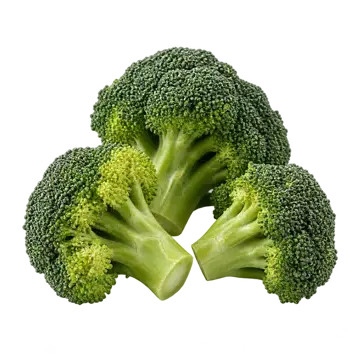
    Broccoli, raw
    85 g · US food database (USDA Foundation Foods)
    86% of the men’s 90 mg
    A lot
    77.6mg
    91.3 mg / 100 g
  11. 11
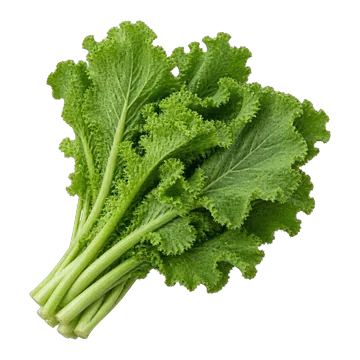
    Mustard greens, raw
    85 g · US food database (USDA SR Legacy)
    66% of the men’s 90 mg
    A lot
    59.5mg
    70 mg / 100 g
  12. 12
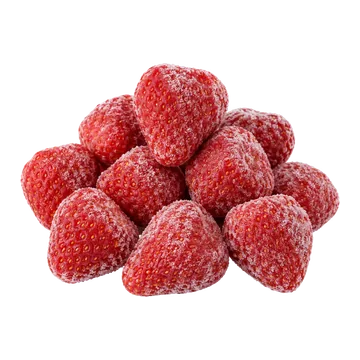
    Strawberries, frozen
    140 g · US food database (USDA SR Legacy)
    64% of the men’s 90 mg
    A lot
    57.7mg
    41.2 mg / 100 g
  13. 13
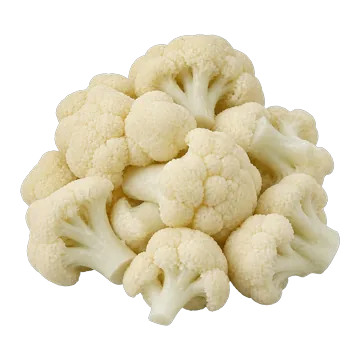
    Cauliflower, raw
    85 g · US food database (USDA Foundation Foods)
    63% of the men’s 90 mg
    A lot
    57mg
    67.1 mg / 100 g
  14. 14
    Brussels sprouts, cooked
    85 g · US food database (USDA SR Legacy)
    59% of the men’s 90 mg
    A lot
    52.7mg
    62 mg / 100 g
  15. 15
    Turnip greens, raw
    85 g · US food database (USDA SR Legacy)
    57% of the men’s 90 mg
    A lot
    51mg
    60 mg / 100 g
  16. 16
    Mango, raw
    140 g · US food database (USDA SR Legacy)
    57% of the men’s 90 mg
    A lot
    51mg
    36.4 mg / 100 g
  17. 17
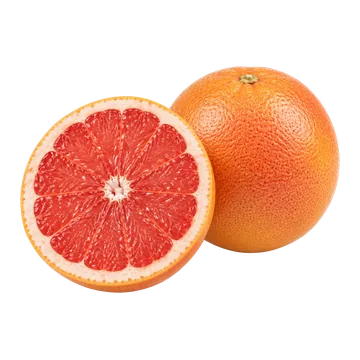
    Grapefruit, raw
    140 g · US food database (USDA SR Legacy)
    54% of the men’s 90 mg
    A lot
    48.2mg
    34.4 mg / 100 g
  18. 18
    Cauliflower, cooked
    85 g · US food database (USDA SR Legacy)
    42% of the men’s 90 mg
    A lot
    37.7mg
    44.3 mg / 100 g
  19. 19
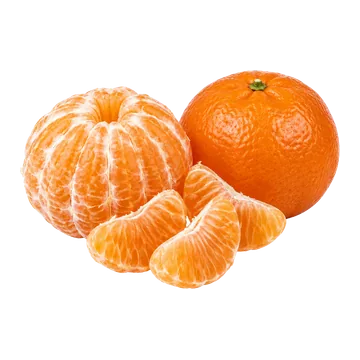
    Mandarins, raw
    140 g · US food database (USDA SR Legacy)
    42% of the men’s 90 mg
    A lot
    37.4mg
    26.7 mg / 100 g
  20. 20
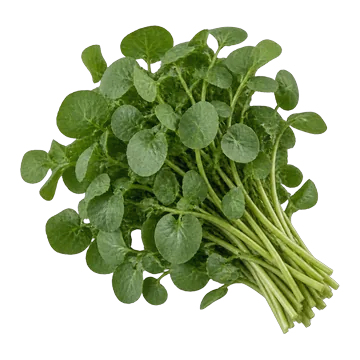
    Watercress, raw
    85 g · US food database (USDA SR Legacy)
    41% of the men’s 90 mg
    A lot
    36.6mg
    43 mg / 100 g
  21. 21
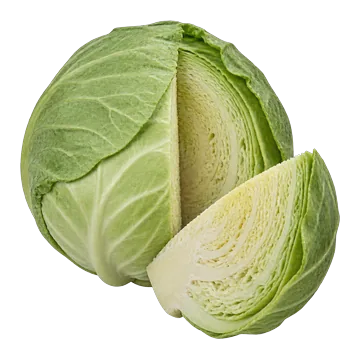
    Green cabbage, raw
    85 g · US food database (USDA Foundation Foods)
    38% of the men’s 90 mg
    A lot
    34.3mg
    40.34 mg / 100 g
  22. 22
    Broccoli, cooked
    85 g · US food database (USDA SR Legacy)
    38% of the men’s 90 mg
    A lot
    34.1mg
    40.1 mg / 100 g
  23. 23
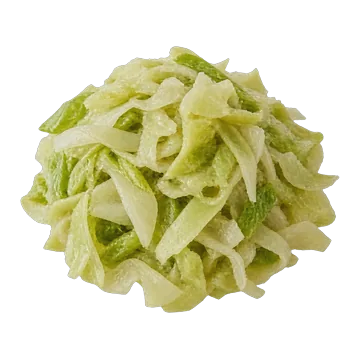
    Green cabbage, cooked
    85 g · US food database (USDA SR Legacy)
    35% of the men’s 90 mg
    A lot
    31.9mg
    37.5 mg / 100 g
  24. 24
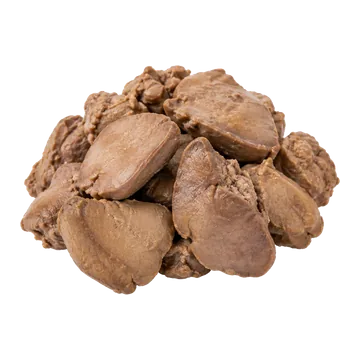
    Chicken liver, simmered
    100 g · US food database (USDA SR Legacy)
    31% of the men’s 90 mg
    A lot
    27.9mg
    27.9 mg / 100 g
  25. 25
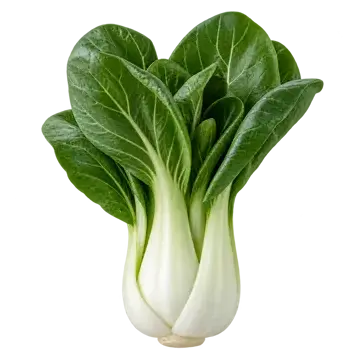
    Bok choy, raw
    85 g · US food database (USDA Foundation Foods)
    29% of the men’s 90 mg
    A lot
    25.8mg
    30.3 mg / 100 g
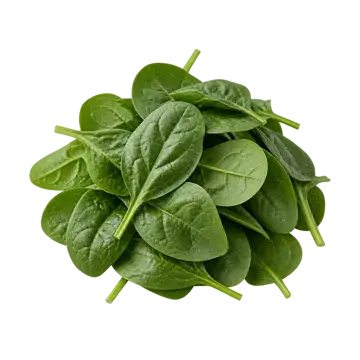
  26. 26
    Spinach, raw
    85 g · US food database (USDA Foundation Foods)
    29% of the men’s 90 mg
    A lot
    25.7mg
    30.27 mg / 100 g
  27. 27
    Turnip greens, cooked
    85 g · US food database (USDA SR Legacy)
    26% of the men’s 90 mg
    A lot
    23.3mg
    27.4 mg / 100 g
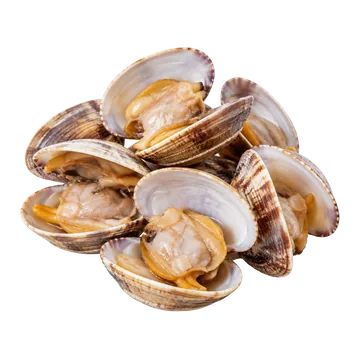
  28. 28
    Clams, cooked
    100 g · US food database (USDA SR Legacy)
    25% of the men’s 90 mg
    A lot
    22.1mg
    22.1 mg / 100 g
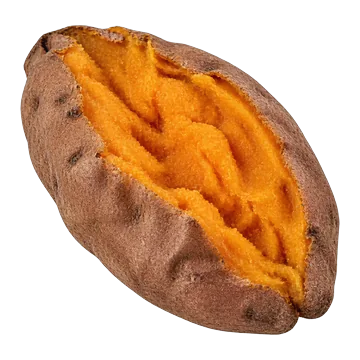
  29. 29
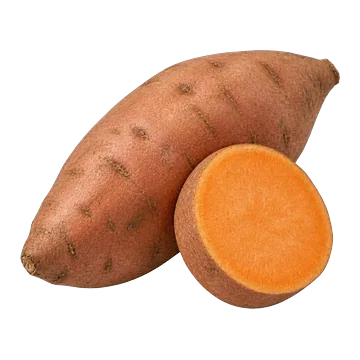
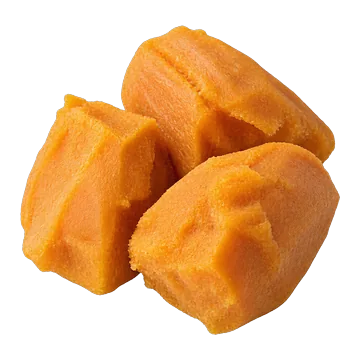
    Sweet potato, baked
    110 g · US food database (USDA SR Legacy)
    24% of the men’s 90 mg
    A lot
    21.6mg
    19.6 mg / 100 g
  30. 30
    Mustard greens, cooked
    85 g · US food database (USDA SR Legacy)
    24% of the men’s 90 mg
    A lot
    21.5mg
    25.3 mg / 100 g
  31. 31
    Turnip greens, frozen, cooked
    85 g · US food database (USDA SR Legacy)
    21% of the men’s 90 mg
    A lot
    18.5mg
    21.8 mg / 100 g
  32. 32
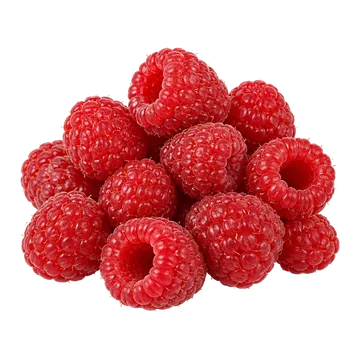
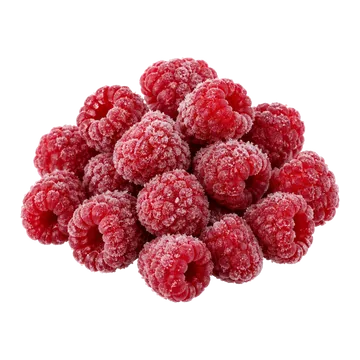
    Raspberries, raw
    80 g · US food database (USDA Foundation Foods)
    20% of the men’s 90 mg
    A lot
    18.4mg
    23.04 mg / 100 g
  33. 33
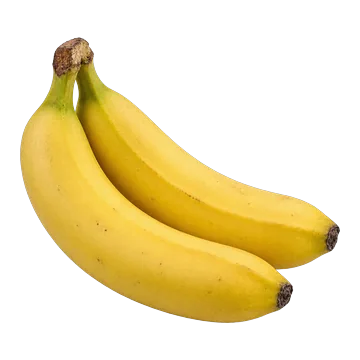
    Banana, raw
    140 g · US food database (USDA Foundation Foods)
    19% of the men’s 90 mg
    Some
    17.2mg
    12.3 mg / 100 g
  34. 34
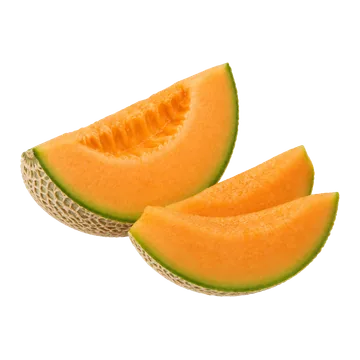
    Cantaloupe, raw
    150 g · US food database (USDA Foundation Foods)
    18% of the men’s 90 mg
    Some
    16.4mg
    10.9 mg / 100 g
  35. 35
    Sweet potato, raw
    110 g · US food database (USDA Foundation Foods)
    18% of the men’s 90 mg
    Some
    16.3mg
    14.84 mg / 100 g
  36. 36
    Kale, cooked
    85 g · US food database (USDA Foundation Foods)
    17% of the men’s 90 mg
    Some
    15.1mg
    17.8 mg / 100 g
  37. 37
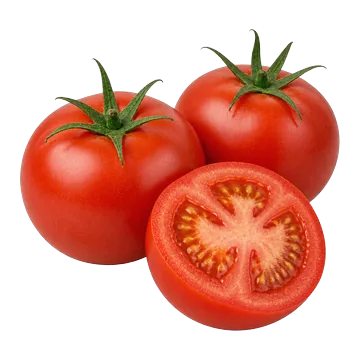
    Tomatoes, raw
    85 g · US food database (USDA Foundation Foods)
    17% of the men’s 90 mg
    Some
    15.1mg
    17.75 mg / 100 g
  38. 38
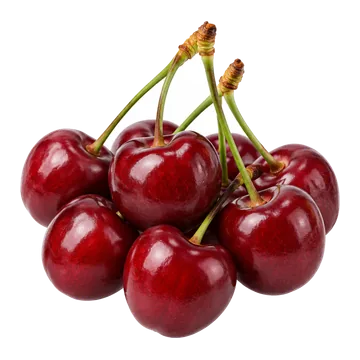
    Cherries, raw
    140 g · US food database (USDA Foundation Foods)
    16% of the men’s 90 mg
    Some
    14.5mg
    10.39 mg / 100 g
  39. 39
    Raspberries, frozen
    80 g · US food database (USDA SR Legacy)
    16% of the men’s 90 mg
    Some
    14.1mg
    17.6 mg / 100 g
  40. 40
    Sweet potato, boiled
    110 g · US food database (USDA SR Legacy)
    16% of the men’s 90 mg
    Some
    14.1mg
    12.8 mg / 100 g
  41. 41
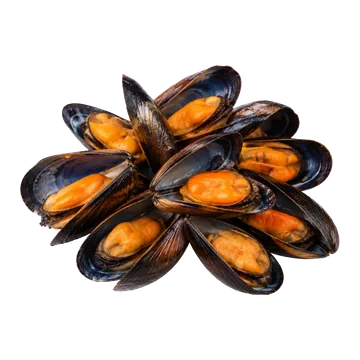
    Mussels, cooked
    100 g · US food database (USDA SR Legacy)
    15% of the men’s 90 mg
    Some
    13.6mg
    13.6 mg / 100 g
  42. 42
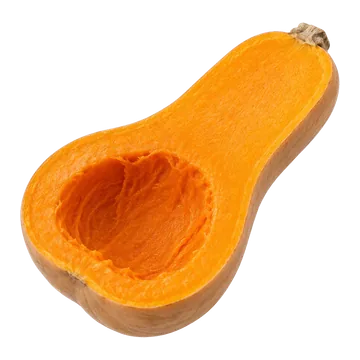
    Butternut squash, baked
    85 g · US food database (USDA SR Legacy)
    14% of the men’s 90 mg
    Some
    12.8mg
    15.1 mg / 100 g
  43. 43
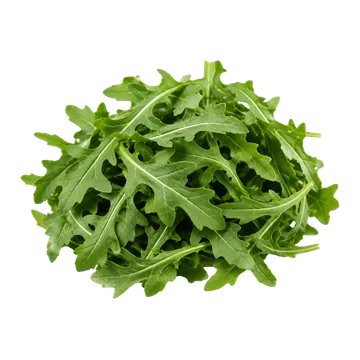
    Arugula, raw
    85 g · US food database (USDA SR Legacy)
    14% of the men’s 90 mg
    Some
    12.8mg
    15 mg / 100 g
  44. 44
    Zucchini, cooked
    85 g · US food database (USDA SR Legacy)
    12% of the men’s 90 mg
    Some
    11mg
    12.9 mg / 100 g
  45. 45
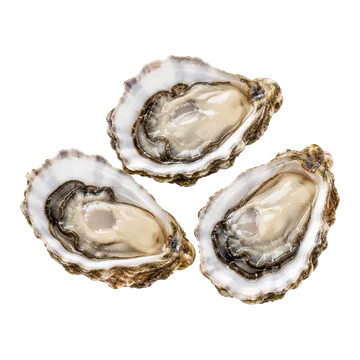
    Pacific oysters, raw
    125 g · US food database (USDA SR Legacy)
    11% of the men’s 90 mg
    Some
    10mg
    8 mg / 100 g
  46. 46
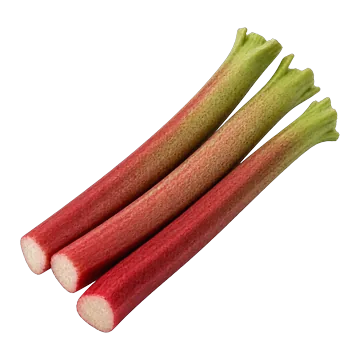
    Rhubarb, raw
    140 g · US food database (USDA Foundation Foods)
    11% of the men’s 90 mg
    Some
    9.7mg
    6.93 mg / 100 g
  47. 47
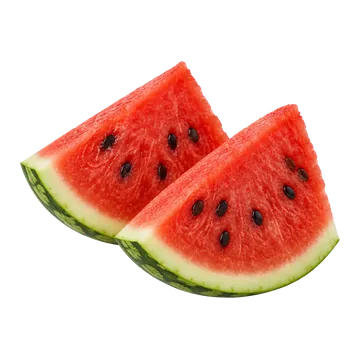
    Watermelon, raw
    150 g · US food database (USDA Foundation Foods)
    11% of the men’s 90 mg
    Some
    9.69mg
    6.46 mg / 100 g
  48. 48
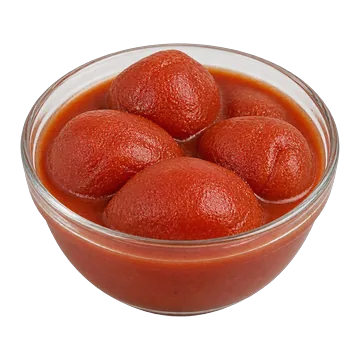
    Tomatoes, canned
    125 g · US food database (USDA Foundation Foods)
    11% of the men’s 90 mg
    Some
    9.63mg
    7.7 mg / 100 g
  49. 49
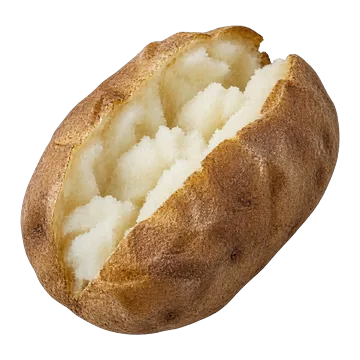
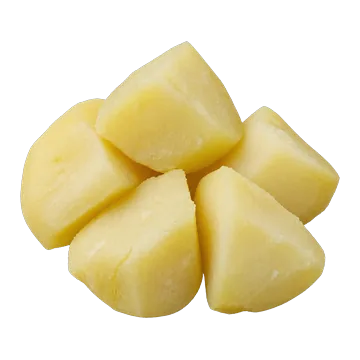
    Potato, baked
    110 g · US food database (USDA SR Legacy)
    10% of the men’s 90 mg
    Some
    9.13mg
    8.3 mg / 100 g
  50. 50
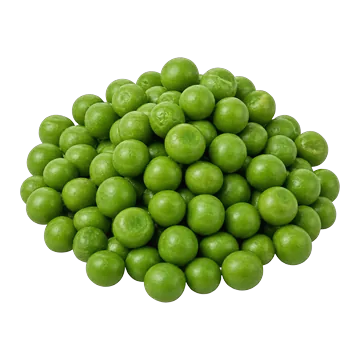
    Green peas, cooked
    85 g · US food database (USDA SR Legacy)
    9% of the men’s 90 mg
    A little
    8.42mg
    9.9 mg / 100 g
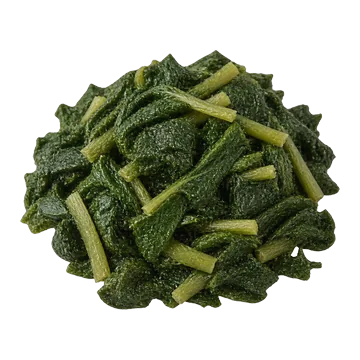
  51. 51
    Spinach, cooked
    85 g · US food database (USDA SR Legacy)
    9% of the men’s 90 mg
    A little
    8.33mg
    9.8 mg / 100 g
  52. 52
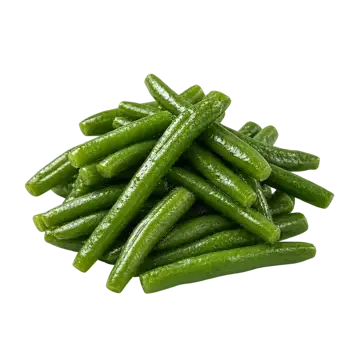
    Green beans, cooked
    85 g · US food database (USDA SR Legacy)
    9% of the men’s 90 mg
    A little
    8.25mg
    9.7 mg / 100 g
  53. 53
    Potato, boiled
    110 g · US food database (USDA SR Legacy)
    9% of the men’s 90 mg
    A little
    8.14mg
    7.4 mg / 100 g
  54. 54
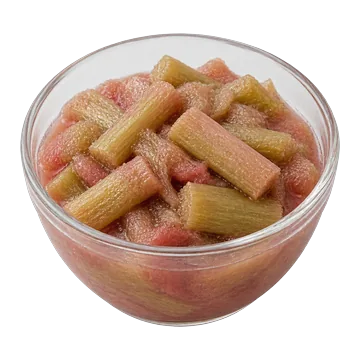
    Rhubarb, stewed
    140 g · UK food tables (CoFID 2021)
    8% of the men’s 90 mg
    A little
    7mg
    5 mg / 100 g
  55. 55
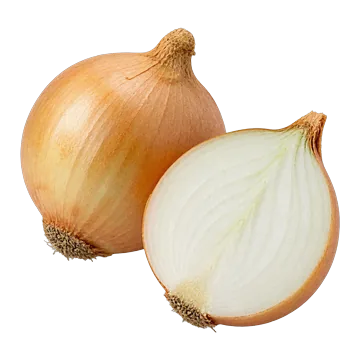
    Onions, raw
    85 g · US food database (USDA Foundation Foods)
    8% of the men’s 90 mg
    A little
    6.97mg
    8.2 mg / 100 g
  56. 56
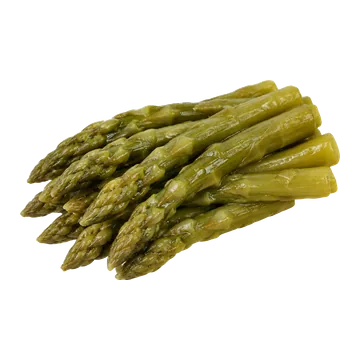
    Asparagus, cooked
    85 g · US food database (USDA SR Legacy)
    7% of the men’s 90 mg
    A little
    6.55mg
    7.7 mg / 100 g
  57. 57
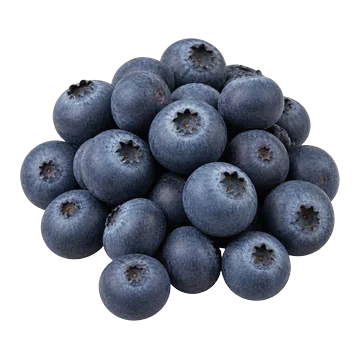
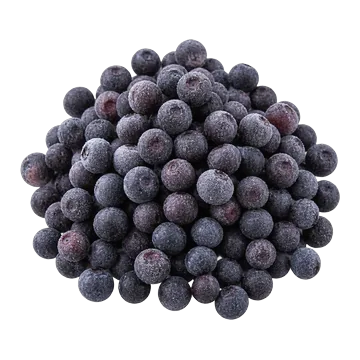
    Blueberries, raw
    80 g · US food database (USDA Foundation Foods)
    7% of the men’s 90 mg
    A little
    6.45mg
    8.06 mg / 100 g
  58. 58
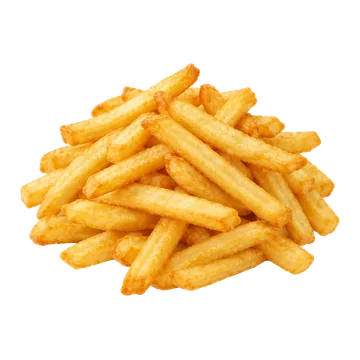
    French fries, frozen, oven-baked
    70 g · US food database (USDA SR Legacy)
    7% of the men’s 90 mg
    A little
    6.02mg
    8.6 mg / 100 g
  59. 59
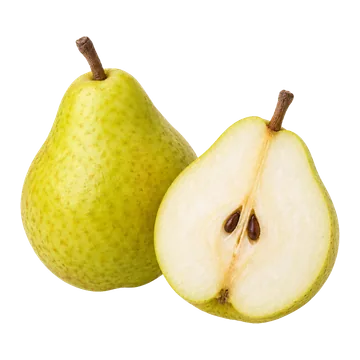
    Pears, raw
    140 g · US food database (USDA SR Legacy)
    7% of the men’s 90 mg
    A little
    6.02mg
    4.3 mg / 100 g
  60. 60
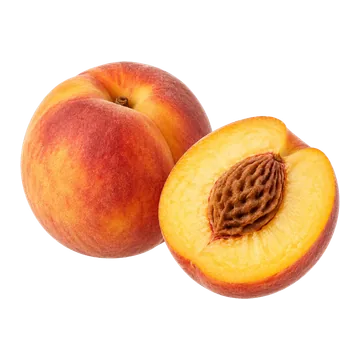
    Peaches, raw
    140 g · US food database (USDA Foundation Foods)
    6% of the men’s 90 mg
    A little
    5.74mg
    4.1 mg / 100 g
  61. 61
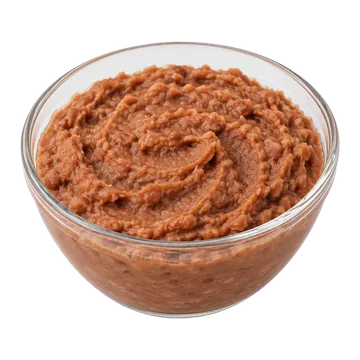
    Refried beans, canned
    90 g · US food database (USDA SR Legacy)
    6% of the men’s 90 mg
    A little
    5.42mg
    6 mg / 100 g
  62. 62
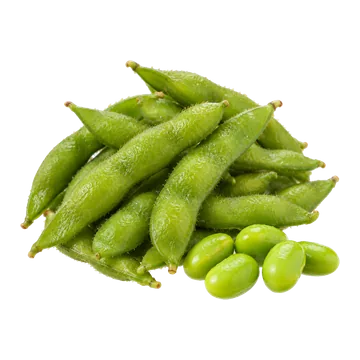
    Edamame, cooked
    85 g · US food database (USDA SR Legacy)
    6% of the men’s 90 mg
    A little
    5.19mg
    6.1 mg / 100 g
  63. 63
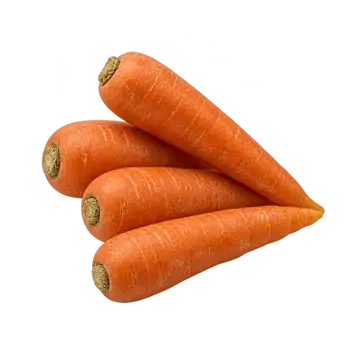
    Carrots, raw
    85 g · US food database (USDA SR Legacy)
    6% of the men’s 90 mg
    A little
    5.02mg
    5.9 mg / 100 g
  64. 64
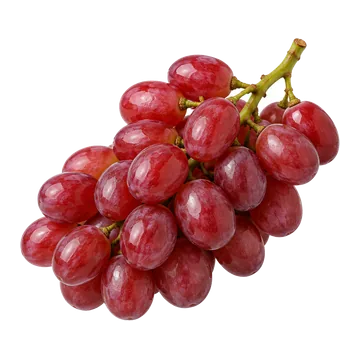
    Grapes, raw
    140 g · US food database (USDA Foundation Foods)
    5% of the men’s 90 mg
    A little
    4.63mg
    3.31 mg / 100 g
  65. 65
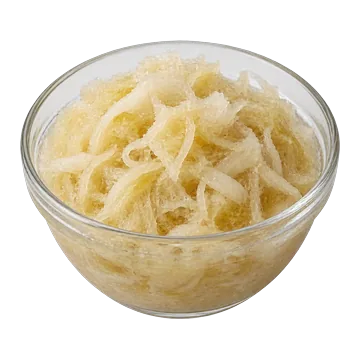
    Sauerkraut
    30 g · US food database (USDA SR Legacy)
    5% of the men’s 90 mg
    A little
    4.41mg
    14.7 mg / 100 g
  66. 66
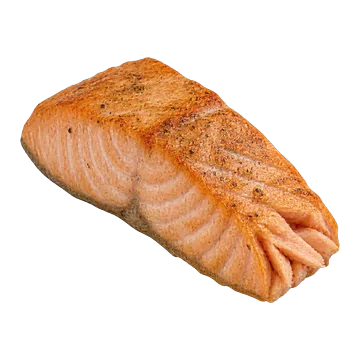
    Farmed salmon, cooked
    100 g · US food database (USDA SR Legacy)
    4% of the men’s 90 mg
    A little
    3.7mg
    3.7 mg / 100 g
  67. 67
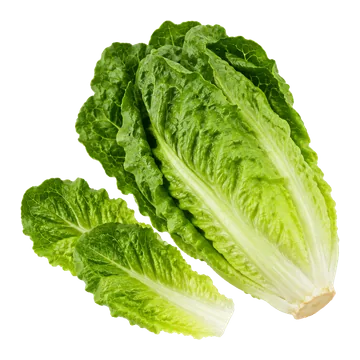
    Romaine lettuce, raw
    85 g · US food database (USDA SR Legacy)
    4% of the men’s 90 mg
    A little
    3.4mg
    4 mg / 100 g
  68. 68
    French fries, restaurant
    70 g · US food database (USDA SR Legacy)
    4% of the men’s 90 mg
    A little
    3.29mg
    4.7 mg / 100 g
  69. 69
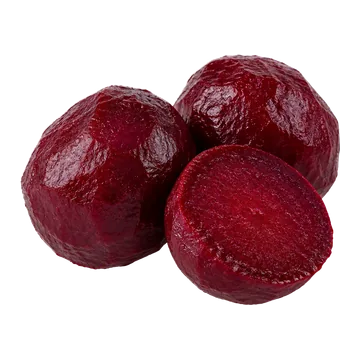
    Beets, cooked
    85 g · US food database (USDA SR Legacy)
    3% of the men’s 90 mg
    A little
    3.06mg
    3.6 mg / 100 g
  70. 70
    Sweet corn, frozen, cooked
    85 g · US food database (USDA SR Legacy)
    3% of the men’s 90 mg
    A little
    2.98mg
    3.5 mg / 100 g
  71. 71
    Oysters, canned
    55 g · US food database (USDA SR Legacy)
    3% of the men’s 90 mg
    A little
    2.75mg
    5 mg / 100 g
  72. 72
    Celery, raw
    85 g · US food database (USDA SR Legacy)
    3% of the men’s 90 mg
    A little
    2.64mg
    3.1 mg / 100 g
  73. 73
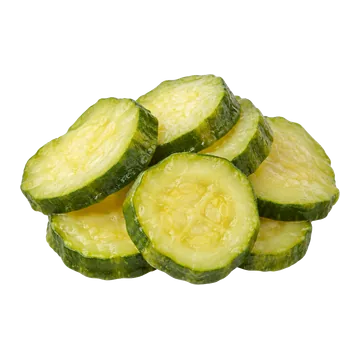
    Cucumber, raw
    85 g · US food database (USDA SR Legacy)
    3% of the men’s 90 mg
    A little
    2.38mg
    2.8 mg / 100 g
  74. 74
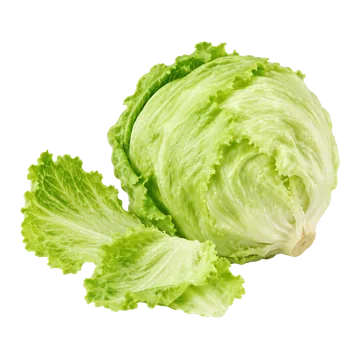
    Iceberg lettuce, raw
    85 g · US food database (USDA SR Legacy)
    3% of the men’s 90 mg
    A little
    2.38mg
    2.8 mg / 100 g
  75. 75
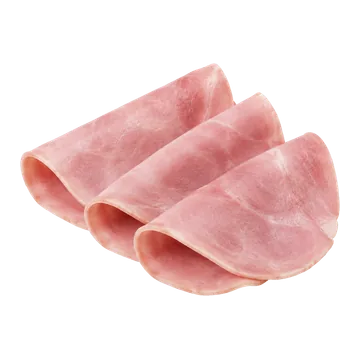
    Ham, sliced
    55 g · US food database (USDA SR Legacy)
    2% of the men’s 90 mg
    A little
    2.2mg
    4 mg / 100 g
  76. 76
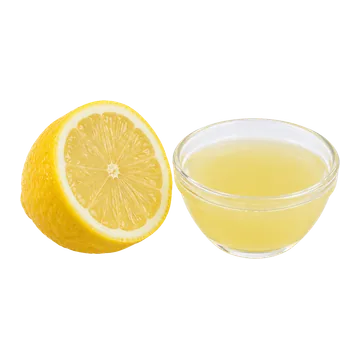
    Lemon juice
    5.2 g · US food database (USDA SR Legacy)
    2% of the men’s 90 mg
    A little
    2.01mg
    38.7 mg / 100 g
  77. 77
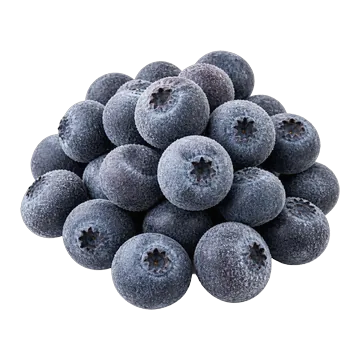
    Blueberries, frozen
    80 g · US food database (USDA SR Legacy)
    2% of the men’s 90 mg
    A little
    2mg
    2.5 mg / 100 g
  78. 78
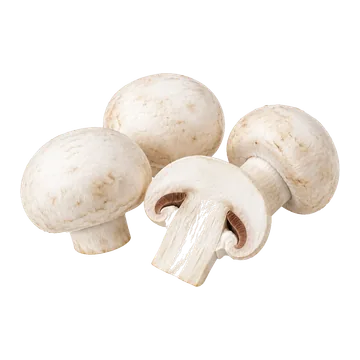
    Mushrooms, raw
    85 g · US food database (USDA SR Legacy)
    2% of the men’s 90 mg
    A little
    1.79mg
    2.1 mg / 100 g
  79. 79
    Mushrooms, UV-exposed, raw
    85 g · US food database (USDA SR Legacy)
    2% of the men’s 90 mg
    A little
    1.79mg
    2.1 mg / 100 g
  80. 80
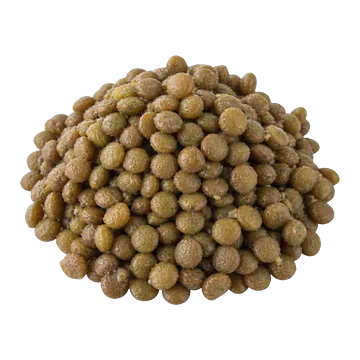
    Lentils, cooked
    105 g · US food database (USDA SR Legacy)
    2% of the men’s 90 mg
    A little
    1.57mg
    1.5 mg / 100 g
  81. 81
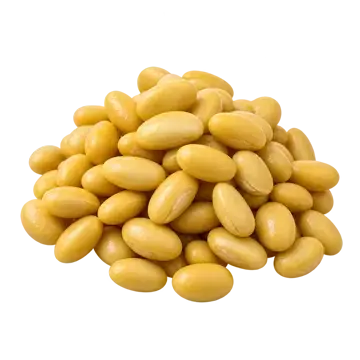
    Soybeans, cooked
    91 g · US food database (USDA SR Legacy)
    2% of the men’s 90 mg
    A little
    1.55mg
    1.7 mg / 100 g
  82. 82
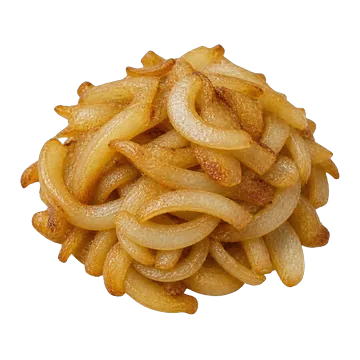
    Onions, sautéed
    85 g · US food database (USDA SR Legacy)
    2% of the men’s 90 mg
    A little
    1.53mg
    1.8 mg / 100 g
  83. 83
    Wild blueberries, frozen
    80 g · US food database (USDA SR Legacy)
    2% of the men’s 90 mg
    A little
    1.36mg
    1.7 mg / 100 g
  84. 84
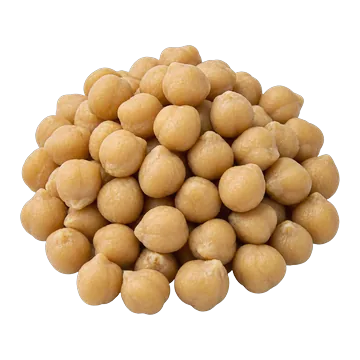
    Chickpeas, cooked
    87 g · US food database (USDA SR Legacy)
    1% of the men’s 90 mg
    Almost none
    1.13mg
    1.3 mg / 100 g
  85. 85
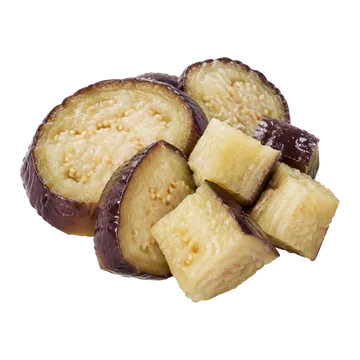
    Eggplant, cooked
    85 g · US food database (USDA SR Legacy)
    1% of the men’s 90 mg
    Almost none
    1.11mg
    1.3 mg / 100 g
  86. 86
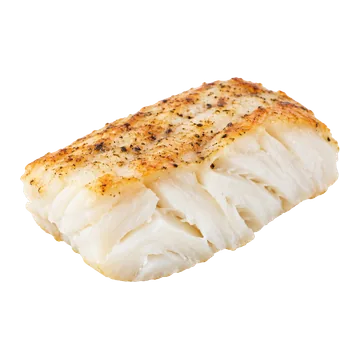
    Cod, baked
    100 g · US food database (USDA SR Legacy)
    1% of the men’s 90 mg
    Almost none
    1mg
    1 mg / 100 g
  87. 87
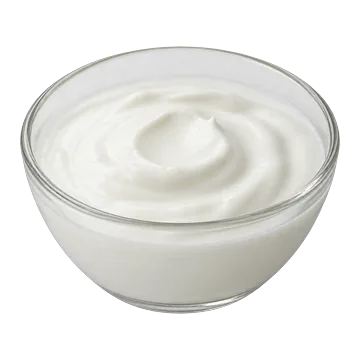
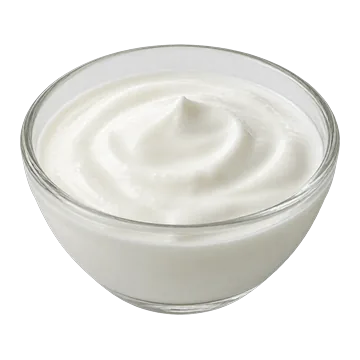
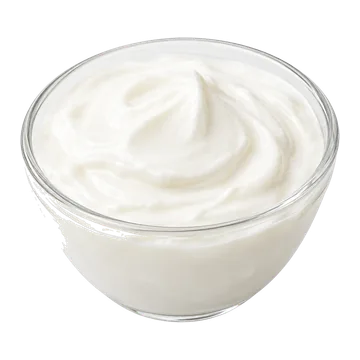
    Plain yogurt, low-fat
    115 g · US food database (USDA SR Legacy)
    1% of the men’s 90 mg
    Almost none
    0.92mg
    0.8 mg / 100 g
  88. 88
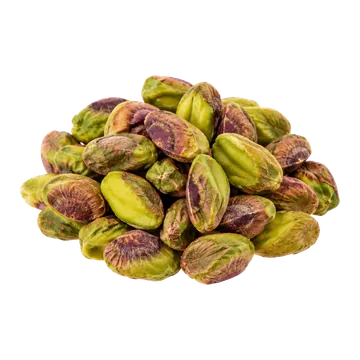
    Pistachios, dry-roasted
    30 g · US food database (USDA SR Legacy)
    1% of the men’s 90 mg
    Almost none
    0.9mg
    3 mg / 100 g
  89. 89
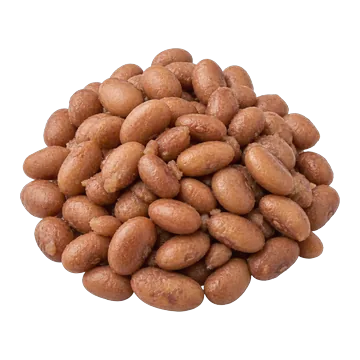
    Pinto beans, cooked
    90 g · US food database (USDA SR Legacy)
    1% of the men’s 90 mg
    Almost none
    0.72mg
    0.8 mg / 100 g
  90. 90
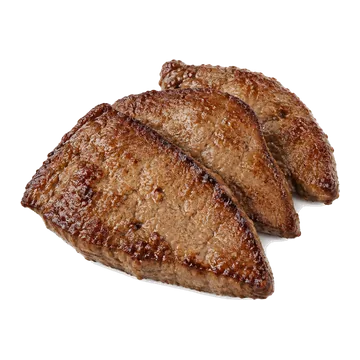
    Beef liver, pan-fried
    100 g · US food database (USDA SR Legacy)
    1% of the men’s 90 mg
    Almost none
    0.7mg
    0.7 mg / 100 g
  91. 91
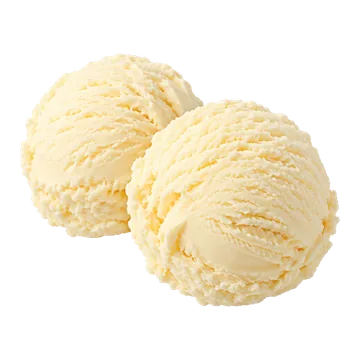
    Ice cream, vanilla
    105 g · US food database (USDA SR Legacy)
    1% of the men’s 90 mg
    Almost none
    0.63mg
    0.6 mg / 100 g
  92. 92
    Kefir, 2–3.9% fat
    193 g · Canadian Nutrient File 2026
    1% of the men’s 90 mg
    Almost none
    0.58mg
    0.3 mg / 100 g
  93. 93
    Plain yogurt, whole milk
    115 g · US food database (USDA SR Legacy)
    1% of the men’s 90 mg
    Almost none
    0.58mg
    0.5 mg / 100 g
  94. 94
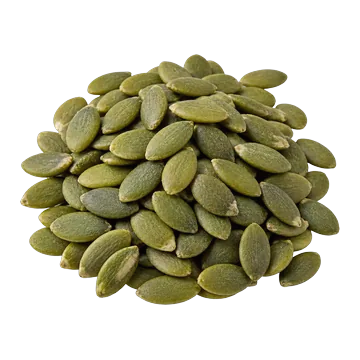
    Pumpkin seeds
    30 g · US food database (USDA SR Legacy)
    1% of the men’s 90 mg
    Almost none
    0.57mg
    1.9 mg / 100 g
  95. 95
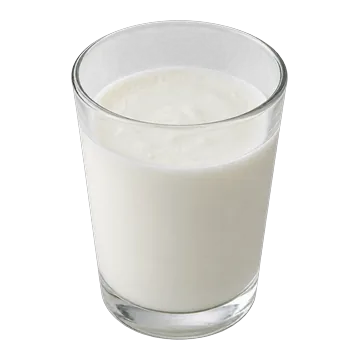
    Milk, 2%
    263 g · US food database (USDA SR Legacy)
    1% of the men’s 90 mg
    Almost none
    0.53mg
    0.2 mg / 100 g
  96. 96
    Sunflower seeds, dry-roasted
    30 g · US food database (USDA SR Legacy)
    under 1% of the men’s 90 mg
    Almost none
    0.42mg
    1.4 mg / 100 g
  97. 97
    Garlic, raw
    4 g · US food database (USDA Foundation Foods)
    under 1% of the men’s 90 mg
    Almost none
    0.4mg
    10 mg / 100 g
  98. 98
    Mackerel, cooked
    100 g · US food database (USDA SR Legacy)
    under 1% of the men’s 90 mg
    Almost none
    0.4mg
    0.4 mg / 100 g
  99. 99
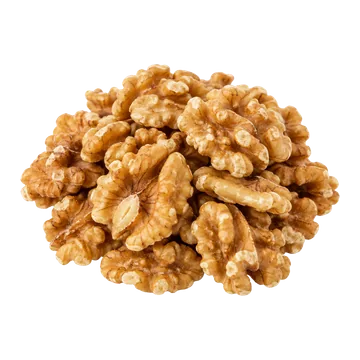
    Walnuts, raw
    30 g · US food database (USDA SR Legacy)
    under 1% of the men’s 90 mg
    Almost none
    0.39mg
    1.3 mg / 100 g
  100. 100
    Kefir, low-fat
    193 g · US food database (USDA SR Legacy)
    under 1% of the men’s 90 mg
    Almost none
    0.39mg
    0.2 mg / 100 g
  101. 101
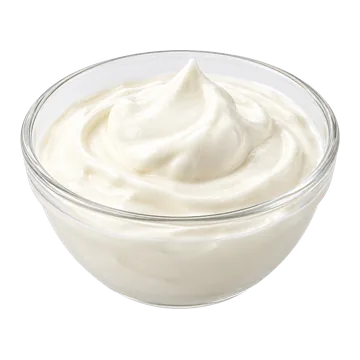
    Sour cream
    29 g · US food database (USDA SR Legacy)
    under 1% of the men’s 90 mg
    Almost none
    0.26mg
    0.9 mg / 100 g
  102. 102
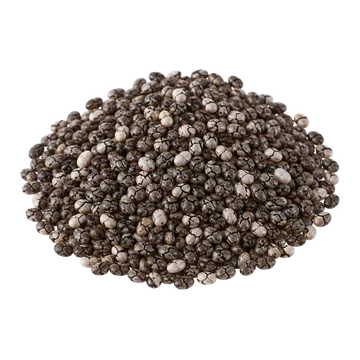
    Chia seeds
    15 g · US food database (USDA SR Legacy)
    under 1% of the men’s 90 mg
    Almost none
    0.24mg
    1.6 mg / 100 g
  103. 103
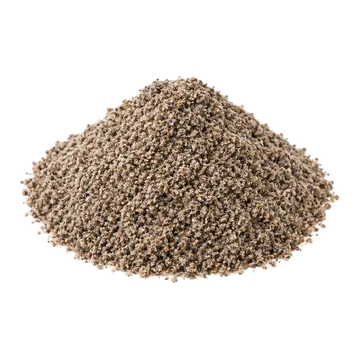
    Chia seeds, ground
    15 g · US food database (USDA SR Legacy)
    under 1% of the men’s 90 mg
    Almost none
    0.24mg
    1.6 mg / 100 g
  104. 104
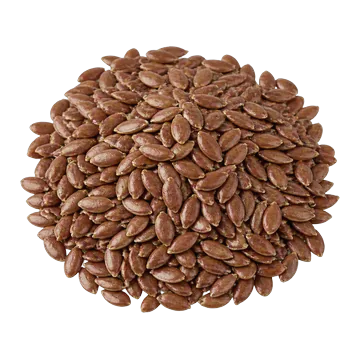
    Flaxseed, whole
    30 g · US food database (USDA SR Legacy)
    under 1% of the men’s 90 mg
    Almost none
    0.18mg
    0.6 mg / 100 g
  105. 105
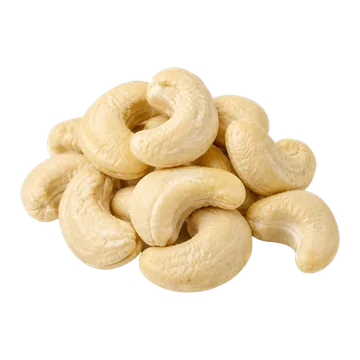
    Cashews, raw
    30 g · US food database (USDA SR Legacy)
    under 1% of the men’s 90 mg
    Almost none
    0.15mg
    0.5 mg / 100 g
  106. 106
    Half-and-half cream
    15.3 g · US food database (USDA SR Legacy)
    under 1% of the men’s 90 mg
    Almost none
    0.14mg
    0.9 mg / 100 g
  107. 107
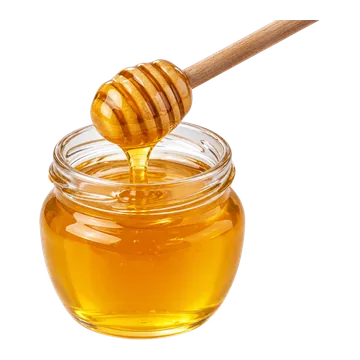
    Honey
    20 g · US food database (USDA SR Legacy)
    under 1% of the men’s 90 mg
    Almost none
    0.1mg
    0.5 mg / 100 g
  108. 108
    Heavy cream
    15.1 g · US food database (USDA SR Legacy)
    under 1% of the men’s 90 mg
    Almost none
    0.09mg
    0.6 mg / 100 g
  109. 109
    Flaxseed, ground
    15 g · US food database (USDA SR Legacy)
    under 1% of the men’s 90 mg
    Almost none
    0.09mg
    0.6 mg / 100 g
  110. 110
    Tofu, calcium-set
    85 g · US food database (USDA SR Legacy)
    under 1% of the men’s 90 mg
    Almost none
    0.09mg
    0.1 mg / 100 g
  111. 111
    Chickpeas, canned
    82 g · US food database (USDA SR Legacy)
    under 1% of the men’s 90 mg
    Almost none
    0.08mg
    0.1 mg / 100 g
  112. 112
    Espresso
    30 g · US food database (USDA SR Legacy)
    under 1% of the men’s 90 mg
    Almost none
    0.06mg
    0.2 mg / 100 g
  113. 113
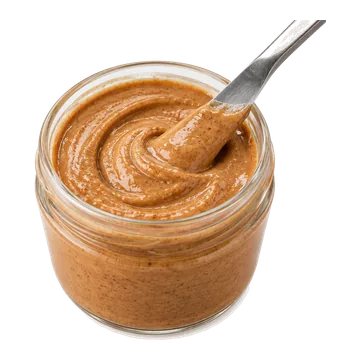
    Almond butter
    15 g · US food database (USDA SR Legacy)
    under 1% of the men’s 90 mg
    Almost none
    0mg
    0 mg / 100 g
  114. 114
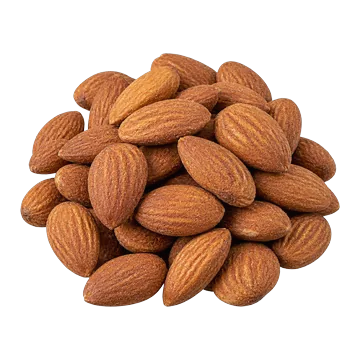
    Almonds, dry-roasted
    30 g · US food database (USDA SR Legacy)
    under 1% of the men’s 90 mg
    Almost none
    0mg
    0 mg / 100 g
  115. 115
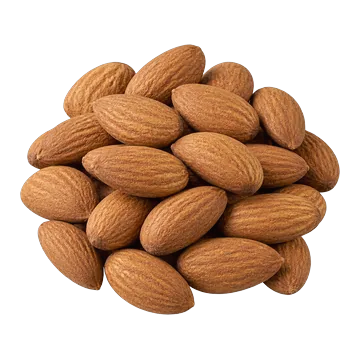
    Almonds, raw
    30 g · US food database (USDA SR Legacy)
    under 1% of the men’s 90 mg
    Almost none
    0mg
    0 mg / 100 g
  116. 116
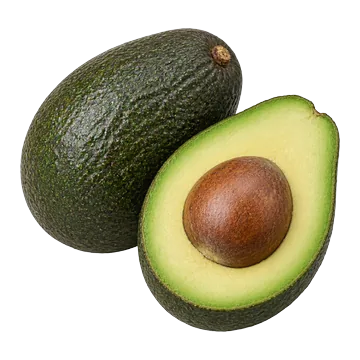
    Avocado, raw
    30 g · US food database (USDA Foundation Foods)
    under 1% of the men’s 90 mg
    Almost none
    0mg
    0 mg / 100 g
  117. 117
    Bacon, pan-fried
    15 g · US food database (USDA SR Legacy)
    under 1% of the men’s 90 mg
    Almost none
    0mg
    0 mg / 100 g
  118. 118
    White beans, cooked
    95 g · US food database (USDA SR Legacy)
    under 1% of the men’s 90 mg
    Almost none
    0mg
    0 mg / 100 g
  119. 119
    Ground beef, 80% lean, cooked
    60 g · US food database (USDA SR Legacy)
    under 1% of the men’s 90 mg
    Almost none
    0mg
    0 mg / 100 g
  120. 120
    Beef steak, top loin, grilled
    100 g · US food database (USDA SR Legacy)
    under 1% of the men’s 90 mg
    Almost none
    0mg
    0 mg / 100 g
  121. 121
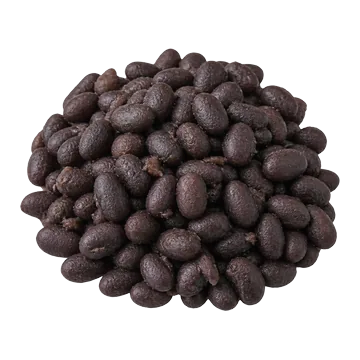
    Black beans, cooked
    91 g · US food database (USDA SR Legacy)
    under 1% of the men’s 90 mg
    Almost none
    0mg
    0 mg / 100 g
  122. 122
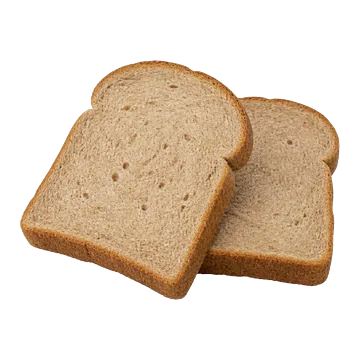
    Whole-wheat bread
    75 g · US food database (USDA SR Legacy)
    under 1% of the men’s 90 mg
    Almost none
    0mg
    0 mg / 100 g
  123. 123
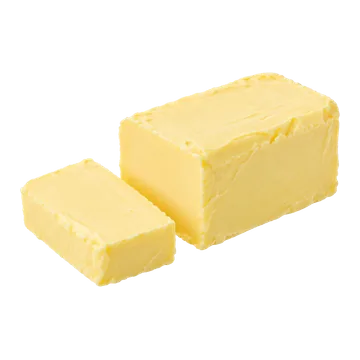
    Butter, salted
    10 g · US food database (USDA SR Legacy)
    under 1% of the men’s 90 mg
    Almost none
    0mg
    0 mg / 100 g
  124. 124
    Butter, unsalted
    10 g · US food database (USDA SR Legacy)
    under 1% of the men’s 90 mg
    Almost none
    0mg
    0 mg / 100 g
  125. 125
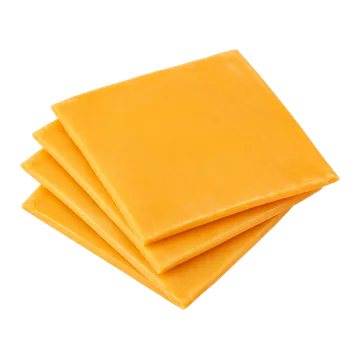
    Processed cheese slices
    30 g · US food database (USDA SR Legacy)
    under 1% of the men’s 90 mg
    Almost none
    0mg
    0 mg / 100 g
  126. 126
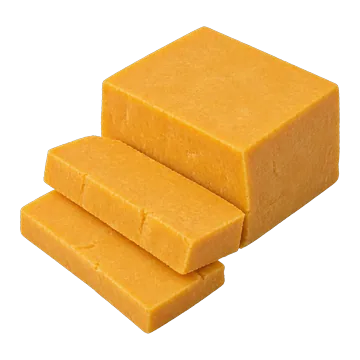
    Cheddar
    30 g · US food database (USDA SR Legacy)
    under 1% of the men’s 90 mg
    Almost none
    0mg
    0 mg / 100 g
  127. 127
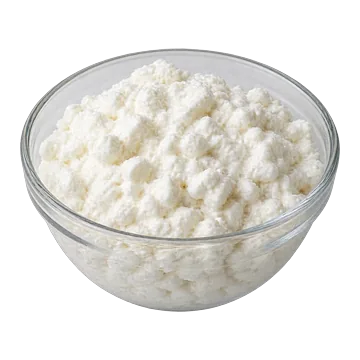
    Cottage cheese
    125 g · US food database (USDA SR Legacy)
    under 1% of the men’s 90 mg
    Almost none
    0mg
    0 mg / 100 g
  128. 128
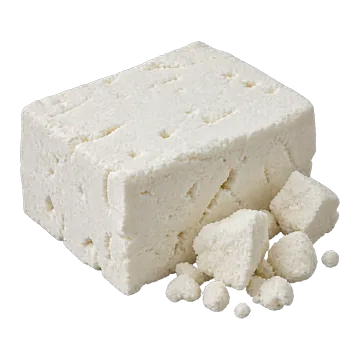
    Feta
    30 g · US food database (USDA SR Legacy)
    under 1% of the men’s 90 mg
    Almost none
    0mg
    0 mg / 100 g
  129. 129
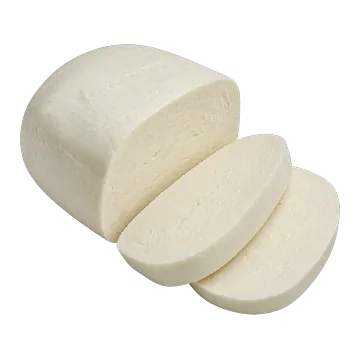
    Mozzarella, part-skim
    30 g · US food database (USDA SR Legacy)
    under 1% of the men’s 90 mg
    Almost none
    0mg
    0 mg / 100 g
  130. 130
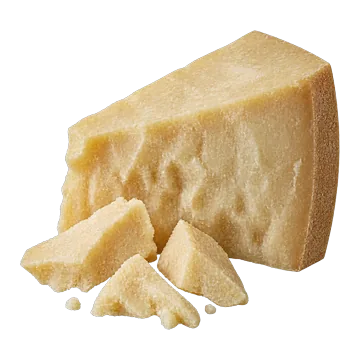
    Parmesan
    15 g · US food database (USDA SR Legacy)
    under 1% of the men’s 90 mg
    Almost none
    0mg
    0 mg / 100 g
  131. 131
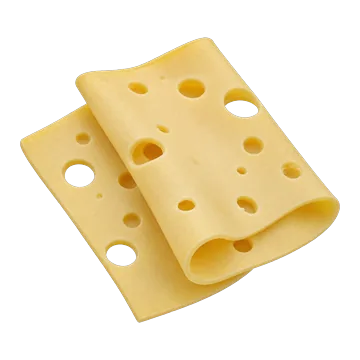
    Swiss cheese
    30 g · US food database (USDA SR Legacy)
    under 1% of the men’s 90 mg
    Almost none
    0mg
    0 mg / 100 g
  132. 132
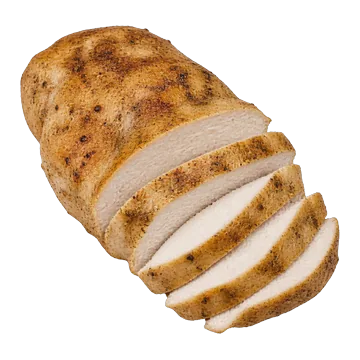
    Chicken breast, roasted
    100 g · US food database (USDA SR Legacy)
    under 1% of the men’s 90 mg
    Almost none
    0mg
    0 mg / 100 g
  133. 133
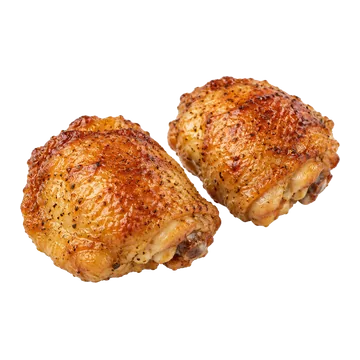
    Chicken thigh, roasted
    100 g · US food database (USDA SR Legacy)
    under 1% of the men’s 90 mg
    Almost none
    0mg
    0 mg / 100 g
  134. 134
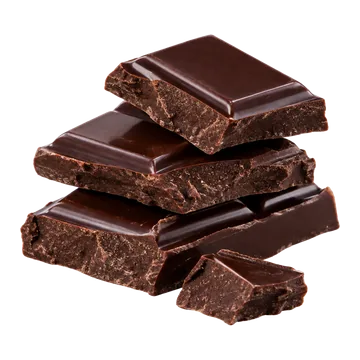
    Dark chocolate
    40 g · US food database (USDA SR Legacy)
    under 1% of the men’s 90 mg
    Almost none
    0mg
    0 mg / 100 g
  135. 135
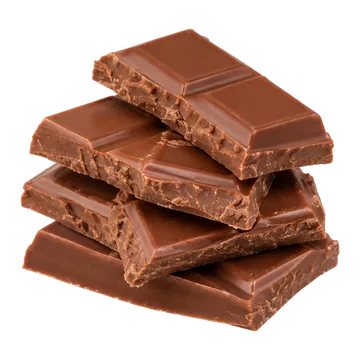
    Milk chocolate
    40 g · US food database (USDA SR Legacy)
    under 1% of the men’s 90 mg
    Almost none
    0mg
    0 mg / 100 g
  136. 136
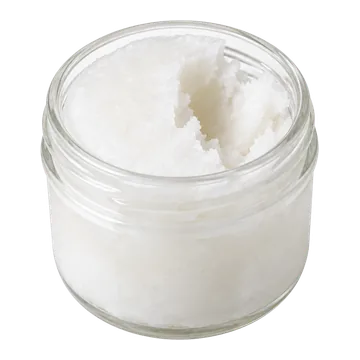
    Coconut oil
    10 g · US food database (USDA SR Legacy)
    under 1% of the men’s 90 mg
    Almost none
    0mg
    0 mg / 100 g
  137. 137
    Coffee, brewed, decaffeinated
    250 g · US food database (USDA SR Legacy)
    under 1% of the men’s 90 mg
    Almost none
    0mg
    0 mg / 100 g
  138. 138
    Coffee, brewed
    250 g · US food database (USDA SR Legacy)
    under 1% of the men’s 90 mg
    Almost none
    0mg
    0 mg / 100 g
  139. 139
    Coffee creamer, flavoured liquid
    15.2 g · US food database (USDA SR Legacy)
    under 1% of the men’s 90 mg
    Almost none
    0mg
    0 mg / 100 g
  140. 140
    Coffee creamer, powder
    2 g · US food database (USDA SR Legacy)
    under 1% of the men’s 90 mg
    Almost none
    0mg
    0 mg / 100 g
  141. 141
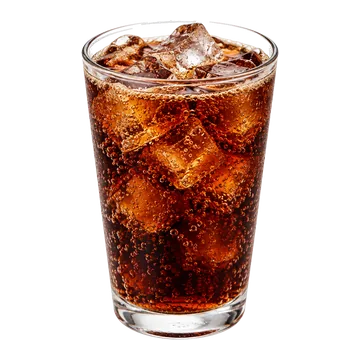
    Cola
    391 g · US food database (USDA SR Legacy)
    under 1% of the men’s 90 mg
    Almost none
    0mg
    0 mg / 100 g
  142. 142
    Corn tortillas
    55 g · US food database (USDA SR Legacy)
    under 1% of the men’s 90 mg
    Almost none
    0mg
    0 mg / 100 g
  143. 143
    Dried cranberries, sweetened
    40 g · US food database (USDA Foundation Foods)
    under 1% of the men’s 90 mg
    Almost none
    0mg
    0 mg / 100 g
  144. 144
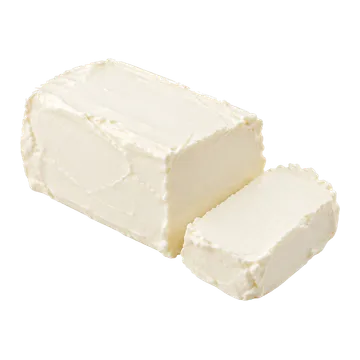
    Cream cheese
    30 g · US food database (USDA SR Legacy)
    under 1% of the men’s 90 mg
    Almost none
    0mg
    0 mg / 100 g
  145. 145
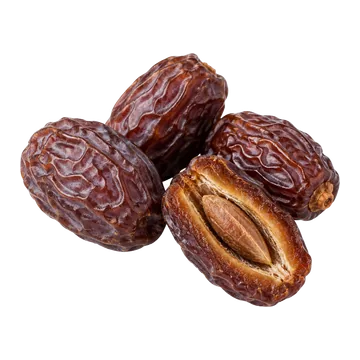
    Medjool dates
    40 g · US food database (USDA SR Legacy)
    under 1% of the men’s 90 mg
    Almost none
    0mg
    0 mg / 100 g
  146. 146
    Diet cola
    375 g · US food database (USDA SR Legacy)
    under 1% of the men’s 90 mg
    Almost none
    0mg
    0 mg / 100 g
  147. 147
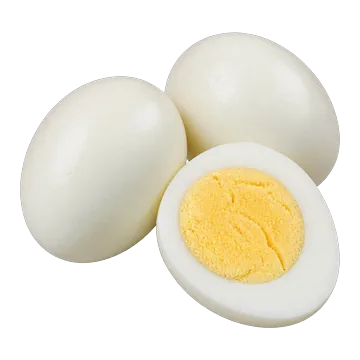
    Eggs, hard-boiled
    100 g · US food database (USDA SR Legacy)
    under 1% of the men’s 90 mg
    Almost none
    0mg
    0 mg / 100 g
  148. 148
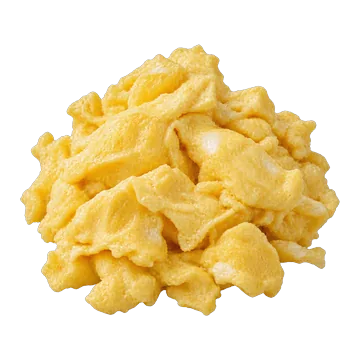
    Eggs, scrambled
    110 g · US food database (USDA SR Legacy)
    under 1% of the men’s 90 mg
    Almost none
    0mg
    0 mg / 100 g
  149. 149
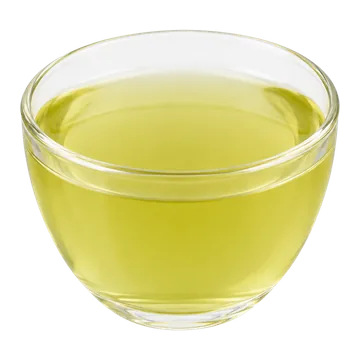
    Green tea, brewed
    250 g · US food database (USDA SR Legacy)
    under 1% of the men’s 90 mg
    Almost none
    0mg
    0 mg / 100 g
  150. 150
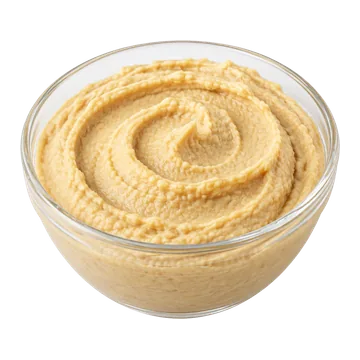
    Hummus
    30 g · US food database (USDA SR Legacy)
    under 1% of the men’s 90 mg
    Almost none
    0mg
    0 mg / 100 g
  151. 151
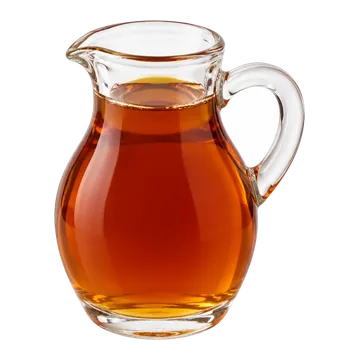
    Maple syrup
    80 g · US food database (USDA SR Legacy)
    under 1% of the men’s 90 mg
    Almost none
    0mg
    0 mg / 100 g
  152. 152
    Mayonnaise
    14 g · US food database (USDA SR Legacy)
    under 1% of the men’s 90 mg
    Almost none
    0mg
    0 mg / 100 g
  153. 153
    Skim milk
    263 g · US food database (USDA SR Legacy)
    under 1% of the men’s 90 mg
    Almost none
    0mg
    0 mg / 100 g
  154. 154
    Oatmeal, cooked with water
    247 g · US food database (USDA SR Legacy)
    under 1% of the men’s 90 mg
    Almost none
    0mg
    0 mg / 100 g
  155. 155
    Olive oil, extra virgin
    9.1 g · US food database (USDA SR Legacy)
    under 1% of the men’s 90 mg
    Almost none
    0mg
    0 mg / 100 g
  156. 156
    Eastern oysters, raw
    125 g · US food database (USDA SR Legacy)
    under 1% of the men’s 90 mg
    Almost none
    0mg
    0 mg / 100 g
  157. 157
    Whole-wheat pasta, cooked
    215 g · US food database (USDA SR Legacy)
    under 1% of the men’s 90 mg
    Almost none
    0mg
    0 mg / 100 g
  158. 158
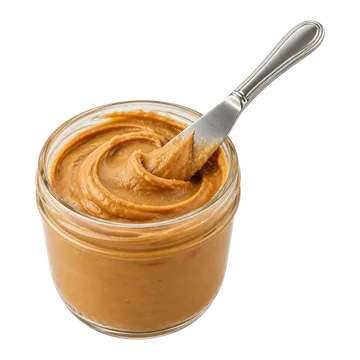
    Peanut butter, smooth
    15 g · US food database (USDA SR Legacy)
    under 1% of the men’s 90 mg
    Almost none
    0mg
    0 mg / 100 g
  159. 159
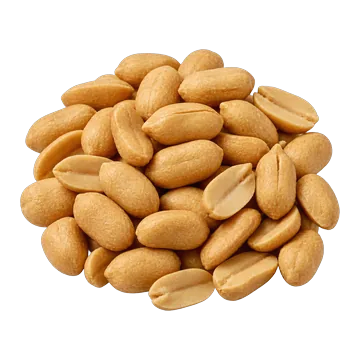
    Peanuts, dry-roasted
    30 g · US food database (USDA SR Legacy)
    under 1% of the men’s 90 mg
    Almost none
    0mg
    0 mg / 100 g
  160. 160
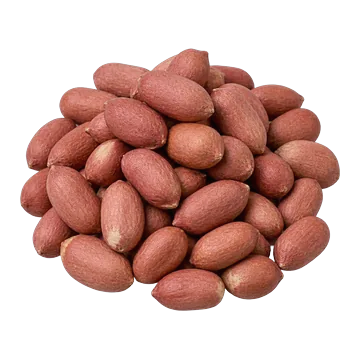
    Peanuts, raw
    30 g · US food database (USDA SR Legacy)
    under 1% of the men’s 90 mg
    Almost none
    0mg
    0 mg / 100 g
  161. 161
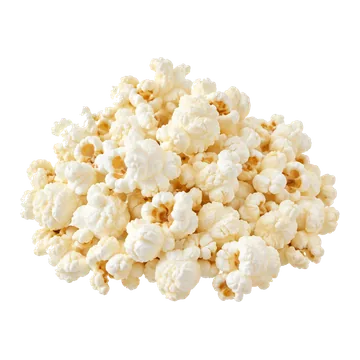
    Popcorn, air-popped
    50 g · US food database (USDA SR Legacy)
    under 1% of the men’s 90 mg
    Almost none
    0mg
    0 mg / 100 g
  162. 162
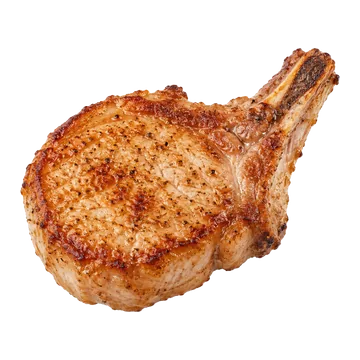
    Pork chop, pan-fried
    100 g · US food database (USDA SR Legacy)
    under 1% of the men’s 90 mg
    Almost none
    0mg
    0 mg / 100 g
  163. 163
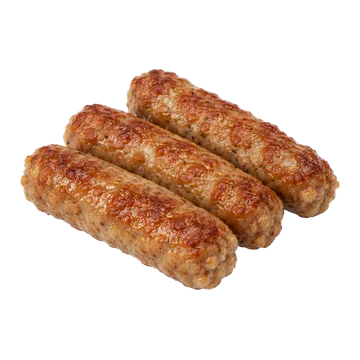
    Pork sausage, pan-fried
    55 g · US food database (USDA SR Legacy)
    under 1% of the men’s 90 mg
    Almost none
    0mg
    0 mg / 100 g
  164. 164
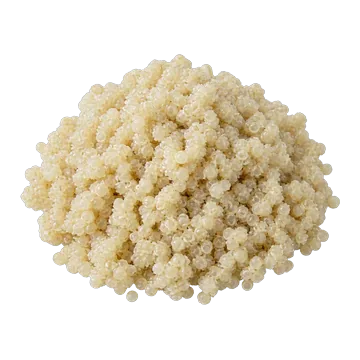
    Quinoa, cooked
    140 g · US food database (USDA SR Legacy)
    under 1% of the men’s 90 mg
    Almost none
    0mg
    0 mg / 100 g
  165. 165
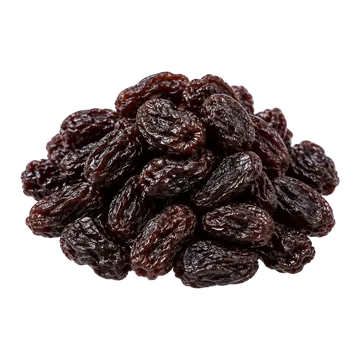
    Raisins
    40 g · US food database (USDA Foundation Foods)
    under 1% of the men’s 90 mg
    Almost none
    0mg
    0 mg / 100 g
  166. 166
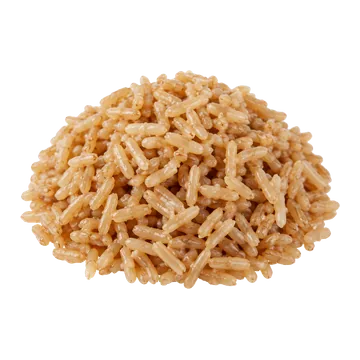
    Brown rice, cooked
    140 g · US food database (USDA SR Legacy)
    under 1% of the men’s 90 mg
    Almost none
    0mg
    0 mg / 100 g
  167. 167
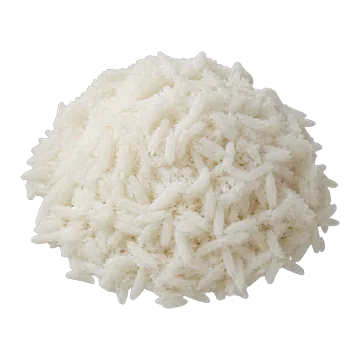
    White rice, cooked
    140 g · US food database (USDA SR Legacy)
    under 1% of the men’s 90 mg
    Almost none
    0mg
    0 mg / 100 g
  168. 168
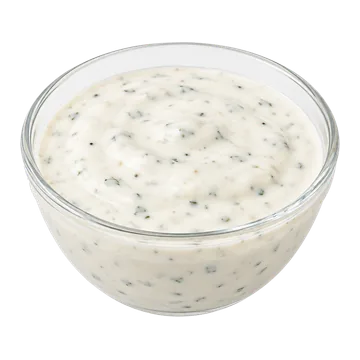
    Ranch dressing
    30.4 g · US food database (USDA SR Legacy)
    under 1% of the men’s 90 mg
    Almost none
    0mg
    0 mg / 100 g
  169. 169
    Sockeye salmon, canned
    55 g · US food database (USDA SR Legacy)
    under 1% of the men’s 90 mg
    Almost none
    0mg
    0 mg / 100 g
  170. 170
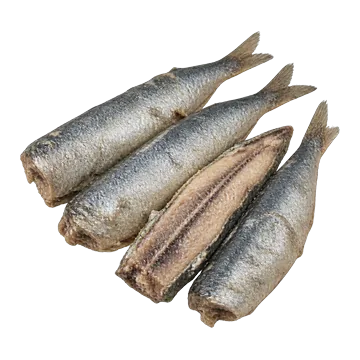
    Sardines, canned in oil
    55 g · US food database (USDA SR Legacy)
    under 1% of the men’s 90 mg
    Almost none
    0mg
    0 mg / 100 g
  171. 171
    Sesame seeds, hulled
    30 g · US food database (USDA SR Legacy)
    under 1% of the men’s 90 mg
    Almost none
    0mg
    0 mg / 100 g
  172. 172
    Sesame seeds, whole
    30 g · US food database (USDA SR Legacy)
    under 1% of the men’s 90 mg
    Almost none
    0mg
    0 mg / 100 g
  173. 173
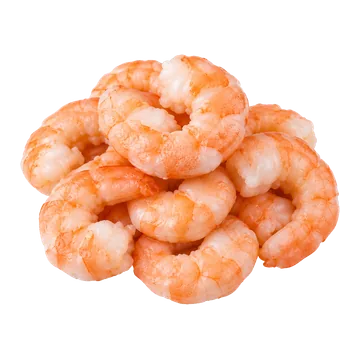
    Shrimp, cooked
    100 g · US food database (USDA SR Legacy)
    under 1% of the men’s 90 mg
    Almost none
    0mg
    0 mg / 100 g
  174. 174
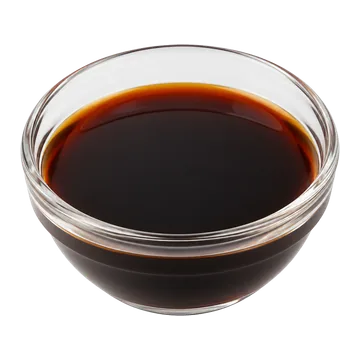
    Soy sauce
    16 g · US food database (USDA SR Legacy)
    under 1% of the men’s 90 mg
    Almost none
    0mg
    0 mg / 100 g
  175. 175
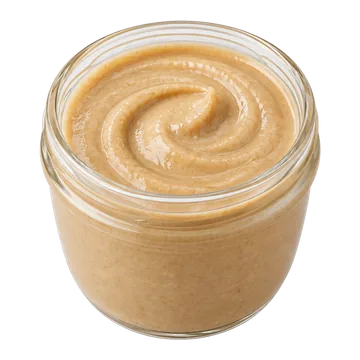
    Tahini
    15 g · US food database (USDA SR Legacy)
    under 1% of the men’s 90 mg
    Almost none
    0mg
    0 mg / 100 g
  176. 176
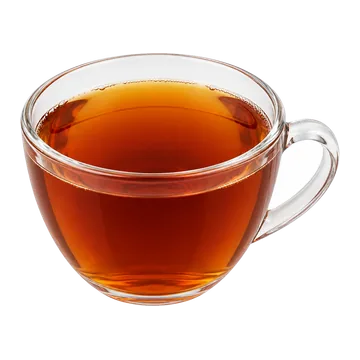
    Black tea, brewed
    250 g · US food database (USDA SR Legacy)
    under 1% of the men’s 90 mg
    Almost none
    0mg
    0 mg / 100 g
  177. 177
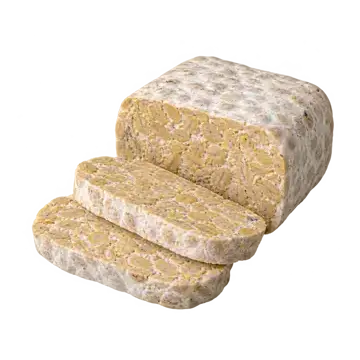
    Tempeh
    85 g · US food database (USDA SR Legacy)
    under 1% of the men’s 90 mg
    Almost none
    0mg
    0 mg / 100 g
  178. 178
    Tilapia, cooked
    100 g · US food database (USDA SR Legacy)
    under 1% of the men’s 90 mg
    Almost none
    0mg
    0 mg / 100 g
  179. 179
    Tortilla chips
    50 g · US food database (USDA SR Legacy)
    under 1% of the men’s 90 mg
    Almost none
    0mg
    0 mg / 100 g
  180. 180
    Albacore (white) tuna, canned in water
    55 g · US food database (USDA SR Legacy)
    under 1% of the men’s 90 mg
    Almost none
    0mg
    0 mg / 100 g
  181. 181
    Light tuna, canned in water
    55 g · US food database (USDA SR Legacy)
    under 1% of the men’s 90 mg
    Almost none
    0mg
    0 mg / 100 g
  182. 182
    Deli turkey breast
    55 g · US food database (USDA SR Legacy)
    under 1% of the men’s 90 mg
    Almost none
    0mg
    0 mg / 100 g
  183. 183
    Ground turkey, 93% lean, cooked
    60 g · US food database (USDA SR Legacy)
    under 1% of the men’s 90 mg
    Almost none
    0mg
    0 mg / 100 g
  184. 184
    Canola oil
    9.2 g · US food database (USDA SR Legacy)
    under 1% of the men’s 90 mg
    Almost none
    0mg
    0 mg / 100 g
  185. 185
    Corn oil
    9.2 g · US food database (USDA SR Legacy)
    under 1% of the men’s 90 mg
    Almost none
    0mg
    0 mg / 100 g
  186. 186
    Soybean oil
    9.2 g · US food database (USDA SR Legacy)
    under 1% of the men’s 90 mg
    Almost none
    0mg
    0 mg / 100 g
  187. 187
    Whey protein concentrate
    30 g · US food database (USDA SR Legacy)
    under 1% of the men’s 90 mg
    Almost none
    0mg
    0 mg / 100 g
  188. 188
    Greek yogurt, plain, nonfat
    115 g · US food database (USDA SR Legacy)
    under 1% of the men’s 90 mg
    Almost none
    0mg
    0 mg / 100 g

Not ranked in this view

These list Vitamin C but have no serving size on file yet.

Not listed

The databases don’t list Vitamin C for these foods: left out, not counted as zero.

Not yet reviewed · shown per 100 g, not per serving

Straight from the national databases, not yet checked, so not ranked. The list can include dried foods, spices and fortified products that a review would set aside.

No serving size yet, so shown per 100 g, even under “per serving”.

Not compared with the upper level: with no serving size, a figure for 100 g of a powder or a concentrate says nothing about what anyone eats. Choose an amount under “per 100 g” to compare one.

Ranked as eaten. Where a food is also listed in a form people eat, these forms are left out: raw meat, poultry, fish and eggs (their cooked forms are ranked), dry grains and legumes, and frozen vegetables before cooking. Raw oysters stay: they have no other form.

Which 19 are left out?
  • raw ground beef
  • Beef liver, raw
  • Beef steak, top loin, raw
  • raw chicken breast
  • Chicken thigh, raw
  • Chicken liver, raw
  • Cod, raw
  • raw eggs
  • dry lentils
  • raw mackerel
  • dry rolled oats
  • dry pasta
  • dry whole-wheat pasta
  • frozen peas
  • Pork chop, raw
  • Pork sausage, raw
  • dry quinoa
  • raw farmed salmon
  • Ground turkey, 93% lean, raw

12 fortified foods are left out: makers add vitamins and minerals in amounts that vary by brand, so check the label for vitamin C: Pies · Breakfast cereal · Almond drink, unsweetened, fortified · White bread · White bread, toasted · Cakes · Cookies · Crackers · Flour tortillas · Pasta, cooked · Soy drink, unsweetened, fortified · Oat drink, unsweetened, fortified

Running low, and too much

Running low

Too little vitamin C causes scurvy: weak connective tissue, joint pain and wounds that heal badly. It is rare in developed countries, and the signs can appear within a month of getting less than about 10 mg a day.

Too much

Vitamin C has low toxicity. Very large doses can cause diarrhea, nausea and stomach cramps. The upper level for adults is 2,000 mg a day.

Sources: NIH Office of Dietary Supplements, vitamin C fact sheet for health professionals (2025-07-31) · Upper levels (adults 19–30): Health Canada, Dietary reference intakes tables: vitamins (2025-11-19)