Cadmium
A metal in soil and water that gets into crops, shellfish and organ meats.
In the body: Builds up in the kidneys over years.
The one to watch: Pacific oysters, raw. About 36 g takes an average adult to the weekly limit, counting what they already eat (120 g if it were the only source). Also Oysters, canned, at about 36 g on the same count. 9 more foods and preparations can push past it too. The rest stay under it at a serving a day. The closest, ground flaxseed, uses up about 76% of the room left. 9 more reviewed foods and preparations carry it but aren’t rated by dose: shown for context, or not rated yet.
The largest shares of what Europeans take in, averaged across all ages, come from staples eaten in quantity: grains and grain products (27%), vegetables (16%) and potatoes (13%). That is why a staple such as pasta can use up a share of the room left.
The evidence behind this: Cadmium: the dose, not the presence
The card counts each food eaten alone, from zero, so its grams run higher than the ones below, which count what an average adult already eats.
Builds up over time. Agencies set an amount you can take in every week, or every day, for life. A food measured against it shows the grams that reach it.
The limit
- The agency’s figure2.5 µg/kg body weight/week
- For a 70 kg adult175 µg a week
- Basistolerable weekly intake (TWI): what you can take in every week for life
tolerable weekly intake (TWI) - Average adult intake1.77 µg/kg body weight/week EFSA 2012: the median of 15 national surveys' middle-bound means for adults is 1.77 µg/kg body weight/week (71% of the tolerable weekly intake; range 1.50–2.23, lower- and upper-bound medians 1.44 and 2.05). Canadian adults in the 2007 Total Diet Study: 1.2–1.75.
- Source ?EFSA 2009
Reviewed foods that carry it
156 reviewed foods carry it, 149 of them rated by dose. A food counts once, as in the foods list: preparations sharing a page (raw and cooked, canned) count once; one with its own page counts apart. Below, one line for each of 190 preparations. 181 of those lines are rated by dose. 219 measurements in all. A preparation measured more than once gets one line, the measurement the dataset leads with or a stricter one, named beside the food; the others fold under it.
Grams to the limit ?
Grams of each food that reach the limit in its window, for a 70 kg adult. Fewest first: those are the foods to watch.
Known background: an average adult already takes in 1.77 µg/kg body weight/week. Where the dataset allows, the grams below are the room left after that intake (the median of the surveys’ averages where EFSA gives one, otherwise the highest); beside each, the same limit counted from zero, the food eaten alone.
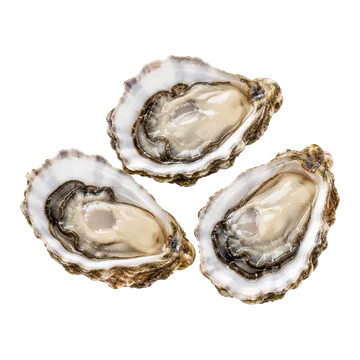 Pacific oysters, raw
Limit it: weekly or less for a 125 g serving
36greaches the limit in a weekafter what an average adult already eats120 g eaten alone, from zero178.8 µg per 125 g servingCFIA mercury and metals in fish (2000–2021) · grade A ?
How it’s rated
Weekly or less: EFSA's tolerable weekly intake (TWI) for cadmium is 2.5 µg/kg body weight/week, 175 µg a week for 70 kg. Eaten alone, about 120 g a week of Pacific oyster meat would reach it. A 125 g serving a day carries 178.8 µg, 1010% of the median adult's 17.7 µg a day. Background (EFSA 2012 adults 1.77, range 1.50–2.23 µg/kg body weight/week) is shown, not subtracted.
Intake: 125 g raw (HC TRA I.3), one serving a day · Level in the food: 1.43 µg/g (mean, n = 39)
Measured on: CFIA inspection results (not a random survey), OYSTER, PACIFIC /JAPANESE, Sample Type Meat, Primary Process Fresh, 2000-2018, Domestic 5 / Export 6 / Import 2 / not stated 26; basis not stated; mean computed by us. This is the BC oyster most Canadians buy; it is a variant row beside the eastern-oyster headline.
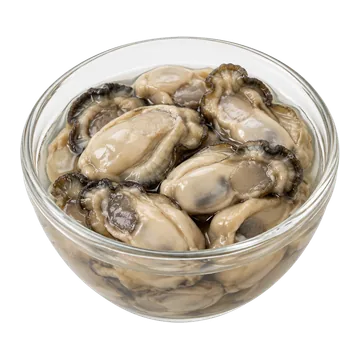 Oysters, canned
Limit it: weekly or less for a 55 g serving
36greaches the limit in a weekafter what an average adult already eats120 g eaten alone, from zero78.7 µg per 55 g servingCFIA mercury and metals in fish (2000–2021) · grade B ?
How it’s rated
Weekly or less: EFSA's 2009 tolerable weekly intake (TWI) for cadmium is 2.5 µg/kg body weight/week, 175 µg a week for 70 kg. No market sample of canned oysters exists yet, so raw Pacific oyster meat stands in (CFIA, 39 samples, mean 1.43 µg/g): eaten alone, about 120 g a week would reach it, and a 55 g serving carries 78.7 µg. The only canned sample, 7.59 µg/g, is shown beside it.
Intake: 55 g canned (HC TRA I.4), one serving a day · Level in the food: 1.43 µg/g (mean, raw Pacific oyster meat (CFIA Meat/Fresh), standing in for canned, n = 39)
Measured on: Stands in for canned oysters (no market sample of canned oysters exists): CFIA inspection results (not a random survey), OYSTER, PACIFIC /JAPANESE, Sample Type Meat, Primary Process Fresh, 2000-2018, Domestic 5 / Export 6 / Import 2 / not stated 26; basis not stated; mean computed by us.
1 other measurement of this food
- CFIA 2013, the one canned oyster sample
Limit it: weekly or less
7greaches the limit in a weekafter what an average adult already eats23 g eaten alone, from zero417 µg per 55 g servingCFIA mercury and metals in fish (2000–2021) · grade C ?
How it’s rated
Weekly or less: shown beside the headline figure. The one canned sample measured (CFIA, 7.59 µg/g) would reach EFSA's tolerable weekly intake for cadmium (2.5 µg/kg body weight/week, 175 µg a week for 70 kg) at about 23 g a week; a 55 g serving carries 417 µg. It is one sample from a harvest-area plan, with more cadmium than its zinc would suggest, so it is not a market figure.
Intake: 55 g canned (HC TRA I.4), one serving a day · Level in the food: 7.59 µg/g (single sample, n = 1)
Measured on: CFIA inspection result, one sample: OYSTER, PACIFIC /JAPANESE, Sample Type Meat, Primary Process Canned, sampled 8 March 2013, Domestic, sampling plan 'Environmental Contaminants - Harvest Area' (system ID 2013FFI-0000101993-4); not a market-basket survey; basis not stated. Raw Pacific oysters in the same file: Meat/Fresh n=39 mean 1.43 µg/g; canning concentrating the metal per gram of product is not documented (the sample could be a smoked or reduced product).
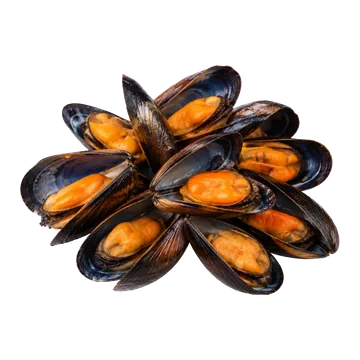 Mussels, cooked
Limit it: weekly or less for a 100 g serving
86greaches the limit in a weekafter what an average adult already eats290 g eaten alone, from zero59.8 µg per 100 g servingCFIA mercury and metals in fish (2000–2021) · grade B ?
How it’s rated
Weekly or less: EFSA's 2009 tolerable weekly intake for cadmium is 2.5 µg/kg body weight/week, 175 µg/week for 70 kg. Cooked mussels average 0.5976 µg/g (CFIA inspection results, 583 samples; the raw mean of 0.2987 doubled for water loss, with no cooking-retention study), so about 293 g cooked a week, eaten alone, would reach it. One 100 g cooked serving carries 59.8 µg, about 267% to 398% of the average adult's whole day (EFSA 2012, 15.0–22.3 µg/day; shown, not subtracted), and 2.4 times the weekly limit if eaten daily.
Intake: 100 g cooked (HC TRA I.3), one serving a day · Level in the food: 0.598 µg/g (mean (raw mean 0.2987 x 2.00 water-loss factor), n = 583)
Measured on: CFIA inspection results (not a random survey), MUSSEL, BLUE, Sample Type Whole, Primary Process Live or Fresh, 2000-2021, domestic, import and export mixed; publisher gives ppm or µg/g (treated alike) and does not state wet or dry basis (wet tissue presumed: zinc and copper agree with USDA); this is RAW tissue as sold. Cooked-basis value = raw mean x 2.00, the ratio of non-water solids in USDA FDC cooked (water 61.15 g/100 g) to raw (80.58 g/100 g) blue mussel, assuming no contaminant is lost in cooking (an upper bound; no cooking-retention study found). No non-detects, so lower bound = upper bound. Raw median 0.258, max 1.37 µg/g.
- Eastern oysters, raw
Limit it: weekly or less for a 125 g serving
120greaches the limit in a weekafter what an average adult already eats400 g eaten alone, from zero54.7 µg per 125 g servingCFIA mercury and metals in fish (2000–2021) · grade B ?
How it’s rated
Weekly or less: EFSA's 2009 tolerable weekly intake (TWI) for cadmium is 2.5 µg/kg body weight/week, 175 µg a week for 70 kg. Eaten alone, about 400 g a week of this oyster would reach it. Background is shown, not subtracted: EFSA 2012's adult mean is 1.77 µg/kg body weight/week (range 1.50–2.23), 124 µg a week or 17.7 µg a day. One 125 g serving a day carries 54.7 µg, 309% of the median adult's 17.7 µg a day (245% to 365% across the survey range) and 2.2 times the whole weekly limit if eaten daily.
Intake: 125 g raw (HC TRA I.3), one serving a day · Level in the food: 0.438 µg/g (mean, n = 69)
Measured on: CFIA inspection results (not a random survey), OYSTER, AMERICAN (eastern oyster), Sample Type Whole, Primary Process Live, 2001-2018, Domestic 44 / Export 14 / Import 2 / not stated 9; publisher gives ppm or µg/g and does not state wet or dry basis (wet tissue presumed); no non-detects, so lower bound = upper bound. Mean computed by us from the CSV rows.
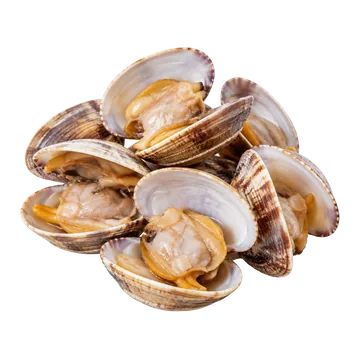 Clams, cooked
Limit it: weekly or less for a 100 g serving
120greaches the limit in a weekafter what an average adult already eats410 g eaten alone, from zero42.6 µg per 100 g servingCFIA mercury and metals in fish (2000–2021) · grade B ?
How it’s rated
Weekly or less: EFSA's 2009 tolerable weekly intake for cadmium is 2.5 µg/kg body weight/week, 175 µg/week for 70 kg. For the clams people steam (21 CFIA samples, excluding the industrial surf clam), cooked meat averages 0.4264 µg/g on the upper bound, so about 410 g cooked a week eaten alone would reach it (669 g on the lower bound). One 100 g cooked serving carries 42.6 µg, 191–284% of an average adult's daily intake (EFSA 2012: 15.0–22.3 µg/day, shown, not subtracted); eaten daily it would be 1.7 times the weekly limit. The cooked figure is the raw mean times 1.73 for water loss, assuming nothing is lost in cooking.
Intake: 100 g cooked (HC TRA I.3), one serving a day · Level in the food: 0.426 µg/g (mean, upper bound, of the 21 Meat rows that are not Stimpson's surf clam (raw upper bound mean 0.2465 x 1.73 water-loss factor), n = 21)
Measured on: CFIA inspection results (not a random survey), CLAM species other than Stimpson's surf clam (soft-shell, geoduck, Manila, cockle and others), Sample Type Meat, any Primary Process, 2000-2021; basis not stated (wet tissue presumed). Mostly RAW or frozen-raw meat. Cooked-basis value = raw mean x 1.73, the ratio of non-water solids in USDA FDC cooked (water 63.64 g/100 g) to raw (78.98 g/100 g) mixed-species clam, assuming nothing is lost in cooking (an upper bound; no retention study found). Lower-bound raw mean 0.1512 (0.2616 cooked).
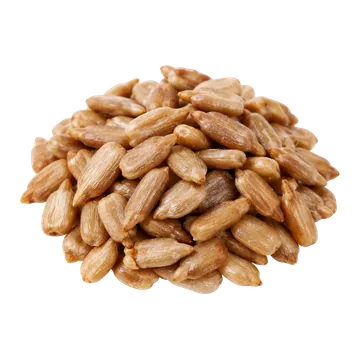 Sunflower seeds, dry-roasted
Go easy: can push past the limit for a 30 g serving
130greaches the limit in a weekafter what an average adult already eats460 g eaten alone, from zeroEating it daily comes to 210 g a week, which is more than the 130 g of room left before the limit.11.4 µg per 30 g servingHealth Canada Total Diet Study, trace elements · grade A ?
How it’s rated
The dataset’s original note, counted from zero and kept as written: A daily serving adds 64% to an average adult's cadmium intake (EFSA 2012 adult median, 1.77 µg/kg body weight/week; Canadian adults in 2007: 1.2-1.75), short of doubling it, so no cap.
Intake: 30 g shelled serving (HC TRA O.1) · Level in the food: 381.6 ng/g (mean of 15 annual Total Diet Study composites (2000-2004, 2006-2012, 2016-2018 (15 annual composites)); 15 of 15 detected; the 1993-99 pooled composite (a separate record) is not averaged in, n = 15)
Measured on: Health Canada Total Diet Study, TDS food JJ11 "Seeds, shelled (Sunflower seeds)", as consumed, single-year composites 2000-2018; Canada. The set mean is the mean of annual composite results, not of individual samples
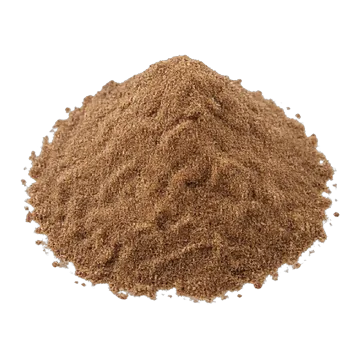 Flaxseed, ground
Nothing to watch: under the limit for a 15 g serving
140greaches the limit in a weekafter what an average adult already eats480 g eaten alone, from zeroEating it daily comes to 105 g a week, which stays within the 140 g of room left before the limit.5.52 µg per 15 g servingHow it’s rated
A daily serving adds 31% to an average adult's cadmium intake (EFSA 2012 adult median, 1.77 µg/kg body weight/week; Canadian adults in 2007: 1.2-1.75), far from doubling it, so no cap.
Intake: one 15.0 g serving a day (TRA C.5, milled flax), 70 kg adult · Level in the food: 368 µg/kg (mean (8 samples), n = 8)
Measured on: food-specific Canadian: CFIA Pesticides and Metals in Selected Foods 2018-19, product 'Seed - Flax' (West, Ontario, Quebec; domestic, import, unknown origin); min 0.116, max 0.538 mg/kg
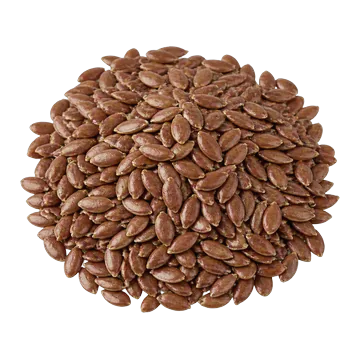 Flaxseed, whole
Go easy: can push past the limit for a 30 g serving
140greaches the limit in a weekafter what an average adult already eats480 g eaten alone, from zeroEating it daily comes to 210 g a week, which is more than the 140 g of room left before the limit.11.04 µg per 30 g servingHow it’s rated
The dataset’s original note, counted from zero and kept as written: A daily serving adds 62% to an average adult's cadmium intake (EFSA 2012 adult median, 1.77 µg/kg body weight/week; Canadian adults in 2007: 1.2-1.75), short of doubling it, so no cap.
Intake: one 30 g serving a day, 70 kg adult · Level in the food: 368 µg/kg (mean (8 samples), n = 8)
Measured on: food-specific Canadian: CFIA Pesticides and Metals in Selected Foods 2018-19, product 'Seed - Flax' (West, Ontario, Quebec; domestic, import, unknown origin); min 0.116, max 0.538 mg/kg
 Dark chocolate
Nothing to watch: under the limit for a 40 g serving
380greaches the limit in a weekafter what an average adult already eats1,300 g eaten alone, from zeroEating it daily comes to 280 g a week, which stays within the 380 g of room left before the limit.5.4 µg per 40 g servingHow it’s rated
A daily serving adds 31% to an average adult's cadmium intake (EFSA 2012 adult median, 1.77 µg/kg body weight/week; Canadian adults in 2007: 1.2-1.75), far from doubling it, so no cap.
Intake: one 40 g serving a day, 70 kg adult (Health Canada TRA U.1, 40 g) · Level in the food: 135 µg/kg (mean, n = 58)
Measured on: EFSA 2012 (EFSA J 10(1):2551) Table 2, FoodEx level 3 'Bitter-sweet chocolate'; N = 58 analytical results; European countries, mainly 2003-2011; mean µg/kg lower bound = MB = upper bound = 135 (no left-censoring effect). Europe (not Canada).
3 other measurements of this food
- EFSA 2012, European bitter chocolate
Nothing to watch: under the limit
420greaches the limit in a weekafter what an average adult already eats1,400 g eaten alone, from zeroEating it daily comes to 280 g a week, which stays within the 420 g of room left before the limit.4.92 µg per 40 g servingHow it’s rated
A daily serving adds 28% to an average adult's cadmium intake (EFSA 2012 adult median, 1.77 µg/kg body weight/week; Canadian adults in 2007: 1.2-1.75), far from doubling it, so no cap.
Intake: one 40 g serving a day, 70 kg adult (Health Canada TRA U.1, 40 g) · Level in the food: 123 µg/kg (mean, n = 30)
Measured on: EFSA 2012 Table 2, FoodEx level 3 'Bitter chocolate'; N = 30 analytical results; European countries, mainly 2003-2011; mean µg/kg lower bound = MB = upper bound = 123. Europe.
- Serbia 2024, 49 dark bars (50% cacao or more)
Nothing to watch: under the limit
900greaches the limit in a weekafter what an average adult already eats3,100 g eaten alone, from zeroEating it daily comes to 280 g a week, which stays within the 900 g of room left before the limit.2.28 µg per 40 g servingSerbia 2024 · grade B ?
How it’s rated
A daily serving adds 13% to an average adult's cadmium intake (EFSA 2012 adult median, 1.77 µg/kg body weight/week; Canadian adults in 2007: 1.2-1.75), far from doubling it, so no cap.
Intake: one 40 g serving a day, 70 kg adult (Health Canada TRA U.1, 40 g) · Level in the food: 57 µg/kg (mean, n = 49)
Measured on: Serbia 2024 (Nesic et al., Foods 14:18): 49 retail dark chocolates (Table 1; the abstract says n = 155 overall, Methods and Table 1 say 150), cacao ≥50%, Belgrade market, 2022; ICP-MS; mean 0.057 mg/kg (median 0.042, min 0.014, max 0.29).
- US 2014-22, mixed cocoa products (context)
Context
No gram figure for this foodShown for context, not rated by dose: “How it’s rated” says why, so there is no gram figure here.Hands 2024 · grade B ?
How it’s rated
Context only (mixed cocoa products, selection bias). Grams to the limit would be 175 ÷ 0.396 = 442 g a week, but it is not used for the rating: the figure is not a dark-chocolate-bar concentration.
Intake: one 40 g serving a day, 70 kg adult (Health Canada TRA U.1, 40 g) · Level in the food: 396 µg/kg (mean, n = 72)
Measured on: Hands et al. 2024 (Front Nutr 11:1366231): 72 US consumer cocoa-containing products, 2014-2022 (four cohorts), bought by ConsumerLab.com; ICP-MS; mean 0.396 µg/g, median 0.239, min 0.016, max 2.2. MIXED products (dark chocolate, cocoa powder and other cocoa products), not separable as dark chocolate bars.
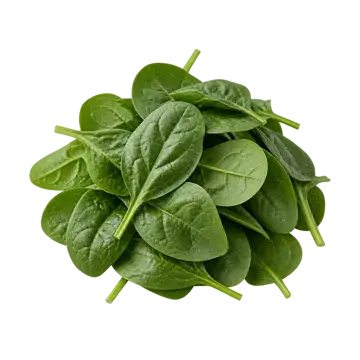 Spinach, raw
Go easy: can push past the limit for a 85 g serving
470greaches the limit in a weekafter what an average adult already eats1,600 g eaten alone, from zeroEating it daily comes to 595 g a week, which is more than the 470 g of room left before the limit.9.2 µg per 85 g servingHealth Canada Total Diet Study, trace elements · grade A ?
How it’s rated
The dataset’s original note, counted from zero and kept as written: A daily serving adds 52% to an average adult's cadmium intake (EFSA 2012 adult median, 1.77 µg/kg body weight/week; Canadian adults in 2007: 1.2-1.75), short of doubling it, so no cap.
Intake: one 85 g serving a day, 70 kg adult · Level in the food: 107.8 µg/kg (mean, n = 11)
Measured on: food-specific: HC TDS GG22, 11 composites 2005–2018 (cooked and raw mixed)
- Spinach, cooked
Go easy: can push past the limit for a 85 g serving
470greaches the limit in a weekafter what an average adult already eats1,600 g eaten alone, from zeroEating it daily comes to 595 g a week, which is more than the 470 g of room left before the limit.9.2 µg per 85 g servingHealth Canada Total Diet Study, trace elements · grade B ?
How it’s rated
The dataset’s original note, counted from zero and kept as written: A daily serving adds 52% to an average adult's cadmium intake (EFSA 2012 adult median, 1.77 µg/kg body weight/week; Canadian adults in 2007: 1.2-1.75), short of doubling it, so no cap.
Intake: one 85 g serving a day, 70 kg adult · Level in the food: 107.8 µg/kg (mean, n = 11)
Measured on: food-specific: HC TDS GG22, 11 composites 2005–2018 (cooked and raw mixed)
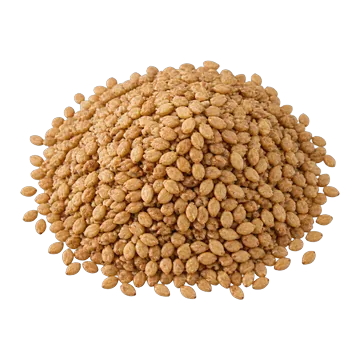 Sesame seeds, whole
Nothing to watch: under the limit for a 30 g serving
570greaches the limit in a weekafter what an average adult already eats2,000 g eaten alone, from zeroEating it daily comes to 210 g a week, which stays within the 570 g of room left before the limit.2.7 µg per 30 g servingCFIA 2018–2019 · grade B ?
How it’s rated
A daily serving adds 15% to an average adult's cadmium intake (EFSA 2012 adult median, 1.77 µg/kg body weight/week; Canadian adults in 2007: 1.2-1.75), far from doubling it, so no cap.
Intake: one 30 g serving a day, 70 kg adult · Level in the food: 89 µg/kg (mean of quantifiable results only (positives-only mean), n = 470)
Measured on: category, not sesame-specific: CFIA 'nut/seed products' 2018-19, retail, 6 Canadian cities (the report names flaxseed and sunflower among them; sesame is not broken out)
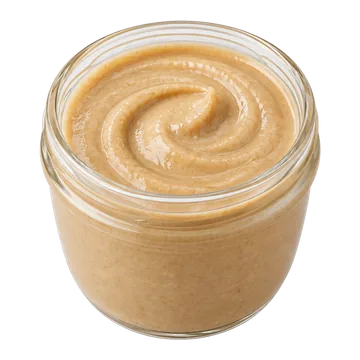 Tahini
Nothing to watch: under the limit for a 15 g serving
570greaches the limit in a weekafter what an average adult already eats2,000 g eaten alone, from zeroEating it daily comes to 105 g a week, which stays within the 570 g of room left before the limit.1.34 µg (15 g × 89 µg/kg) per 15 g servingCFIA 2018–2019 · grade B ?
How it’s rated
A daily serving adds 7.5% to an average adult's cadmium intake (EFSA 2012 adult median, 1.77 µg/kg body weight/week; Canadian adults in 2007: 1.2-1.75), far from doubling it, so no cap.
Intake: one 15.0 g serving a day, 70 kg adult · Level in the food: 89 µg/kg (mean of quantifiable results only (positives-only mean; 72% of samples quantifiable), n = 470)
Measured on: category, not sesame-specific: CFIA 'nut/seed products' 2018-19, retail, 6 Canadian cities (sesame is not broken out)
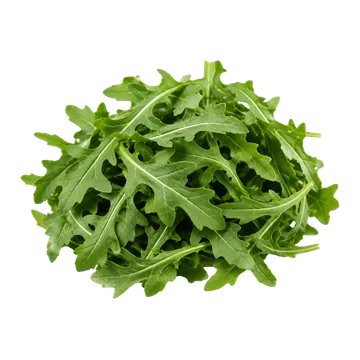 Arugula, raw
Go easy: can push past the limit for a 85 g serving
590greaches the limit in a weekafter what an average adult already eats2,000 g eaten alone, from zeroEating it daily comes to 595 g a week, which is more than the 590 g of room left before the limit.7.3 µg per 85 g servingCFIA chemical residue monitoring (2022–2023) · grade A ?
How it’s rated
The dataset’s original note, counted from zero and kept as written: A daily serving adds 41% to an average adult's cadmium intake (EFSA 2012 adult median, 1.77 µg/kg body weight/week; Canadian adults in 2007: 1.2-1.75), far from doubling it, so no cap.
Intake: one 85 g serving a day, 70 kg adult · Level in the food: 0.086 ppm (lower-bound mean over all n (55 of 56 positive; pooled mean of positives 0.0877); four annual B6 sets pooled by the checker, n = 56)
Measured on: CFIA annex B6 (Food Safety Oversight program) 'Arugula', metals, FOUR years pooled: 2016-17, 2017-18, 2018-19 (n 31, 31 positive, mean of positives 0.1036) plus 2019-20 (n 25, 24 positive, mean of positives 0.06716, max 0.301); n 56, 55 positive; annual annex means 0.0249-0.116 ppm, max 0.842 ppm; non-detects counted as 0 (lower bound); Canada, raw leaf as sampled; no violations. Health Canada TDS has no arugula term, so the agency source is CFIA, not TDS.
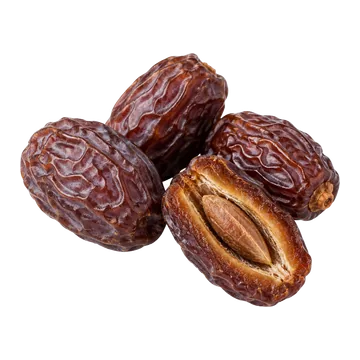 Medjool dates
Nothing to watch: under the limit for a 40 g serving
650greaches the limit in a weekafter what an average adult already eats2,200 g eaten alone, from zeroEating it daily comes to 280 g a week, which stays within the 650 g of room left before the limit.3.16 µg per 40 g servingPubMed 38776020 · grade B ?
How it’s rated
A daily serving adds 18% to an average adult's cadmium intake (EFSA 2012 adult median, 1.77 µg/kg body weight/week; Canadian adults in 2007: 1.2-1.75), far from doubling it, so no cap.
Intake: one 40 g serving a day, 70 kg adult · Level in the food: 0.079 mg/kg (mean (the abstract does not say whether over all 84 samples or the 40 positives), n = 84)
Measured on: El Youssfi et al. 2025 (Biol Trace Elem Res): 84 date fruit samples of four Moroccan varieties (Mejhoul = Medjool, Bouittob, Aziza, Boufegouss) from four growing areas, graphite-furnace AAS; Cd detected in 40 (47.62%), range 0.0004-0.752 mg/kg, mean 0.079 mg/kg; 17 samples (20.24%) above the EU limit of 0.020 mg/kg. Weight basis (fresh fruit or dried) not stated in the abstract. Origin is Morocco, not a Canadian retail sample.
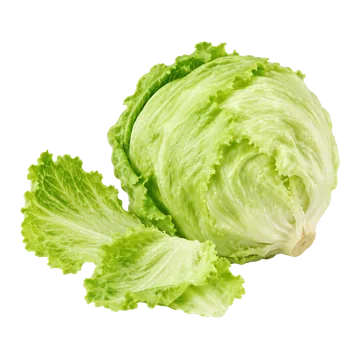 Iceberg lettuce, raw
Nothing to watch: under the limit for a 85 g serving
790greaches the limit in a weekafter what an average adult already eats2,700 g eaten alone, from zeroEating it daily comes to 595 g a week, which stays within the 790 g of room left before the limit.5.49 µg (85 g × 64.6 µg/kg) per 85 g servingCFIA chemical residue monitoring (2016–2023) · grade B ?
How it’s rated
A daily serving adds 31% to an average adult's cadmium intake (EFSA 2012 adult median, 1.77 µg/kg body weight/week; Canadian adults in 2007: 1.2-1.75), far from doubling it, so no cap.
Intake: one 85 g serving a day, 70 kg adult · Level in the food: 64.6 µg/kg (lower-bound mean over all n (n-weighted over four annex lines; 154 of 158 positive; max 598 µg/kg), n = 158)
Measured on: CFIA NCRMP annex B2 (imports), 'Lettuce - head', fresh, 2017-18 to 2022-23. Pooled as an n-weighted mean of the annex rows' lower-bound means over all n, 4 import lines (2017-18+2018-19 n 102; 2019-20+2020-21 n 26; 2021-22 n 17; 2022-23 n 13) = n 158; domestic n 41 (4 lines). Years pooled: 2017-18 to 2022-23, no single-year composite mixed with a multi-year one without n weighting.
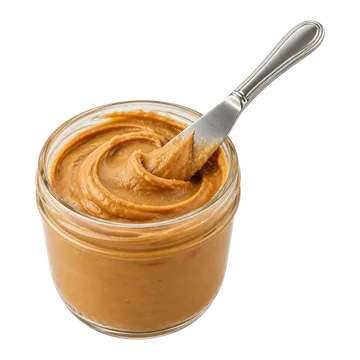 Peanut butter, smooth
Nothing to watch: under the limit for a 15 g serving
800greaches the limit in a weekafter what an average adult already eats2,700 g eaten alone, from zeroEating it daily comes to 105 g a week, which stays within the 800 g of room left before the limit.0.957 µg per 15 g servingHealth Canada Total Diet Study, trace elements · grade A ?
How it’s rated
A daily serving adds 5.4% to an average adult's cadmium intake (EFSA 2012 adult median, 1.77 µg/kg body weight/week; Canadian adults in 2007: 1.2-1.75), far from doubling it, so no cap.
Intake: one 15.0 g serving a day (Health Canada TRA O.3), 70 kg adult · Level in the food: 63.8 ng/g (µg/kg) (mean (equal-weight over composites, two label eras pooled n-weighted), n = 16)
Measured on: Health Canada TDS JJ07 'Peanut butter', As consumed, Canada: 13 composites 2000-2012 (mean 57.3, 0 non-detects) + 3 composites 2016-2018 (mean 91.99, 0 non-detects)
1 other measurement of this food
- US FDA TDS 2018-20, creamy peanut butter
Nothing to watch: under the limit
980greaches the limit in a weekafter what an average adult already eats3,400 g eaten alone, from zeroEating it daily comes to 105 g a week, which stays within the 980 g of room left before the limit.0.78 µg per 15 g servingUS FDA Total Diet Study (2018–2020) · grade A ?
How it’s rated
A daily serving adds 4.4% to an average adult's cadmium intake (EFSA 2012 adult median, 1.77 µg/kg body weight/week; Canadian adults in 2007: 1.2-1.75), far from doubling it, so no cap.
Intake: one 15.0 g serving a day (Health Canada TRA O.3), 70 kg adult · Level in the food: 52 ng/g (µg/kg) (mean, n = 3)
Measured on: US FDA Total Diet Study FY2018-2020, TDS food 47 'Peanut butter, creamy': 3 samples, 3 detects, mean 52 ppb, standard deviation 9.3, range 42-60, reporting limit 1 ppb
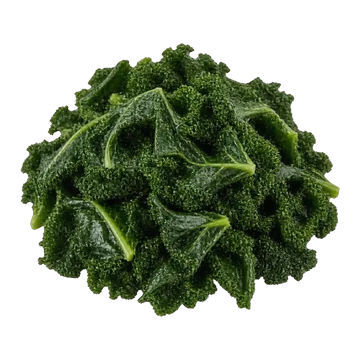 Kale, raw
Nothing to watch: under the limit for a 85 g serving
810greaches the limit in a weekafter what an average adult already eats2,800 g eaten alone, from zeroEating it daily comes to 595 g a week, which stays within the 810 g of room left before the limit.5.39 µg (85 g × 56.35 µg/kg) per 85 g servingCFIA chemical residue monitoring (2016–2023) · grade B ?
How it’s rated
A daily serving adds 30% to an average adult's cadmium intake (EFSA 2012 adult median, 1.77 µg/kg body weight/week; Canadian adults in 2007: 1.2-1.75), far from doubling it, so no cap.
Intake: one 85 g serving a day, 70 kg adult · Level in the food: 63.45 µg/kg (lower-bound mean over all n, n-weighted over three CFIA import lines (pooled mean of positives 0.0654 ppm; 50 of 52 positive); max 481 µg/kg, n = 52)
Measured on: CFIA NCRMP annex B2 (imports), 'Kale', fresh, 2016-17 to 2022-23 (3 lines: METAL 2016-19 n 37; METALS 2019-22 n 13; µg/g 2022-23 n 2). Pooled n-weighted over the three import lines (2016-17 to 2018-19 n 37; 2019-20 to 2021-22 n 13; 2022-23 n 2) = n 52, as for iceberg lettuce.
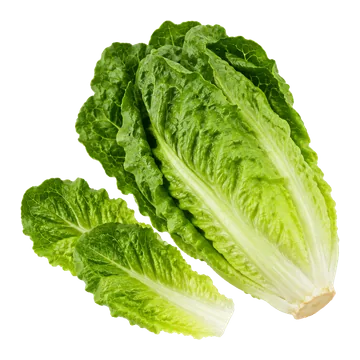 Romaine lettuce, raw
Nothing to watch: under the limit for a 85 g serving
890greaches the limit in a weekafter what an average adult already eats3,000 g eaten alone, from zeroEating it daily comes to 595 g a week, which stays within the 890 g of room left before the limit.4.893 µg per 85 g servingHealth Canada Total Diet Study, trace elements · grade B ?
How it’s rated
A daily serving adds 28% to an average adult's cadmium intake (EFSA 2012 adult median, 1.77 µg/kg body weight/week; Canadian adults in 2007: 1.2-1.75), far from doubling it, so no cap.
Intake: one 85 g serving a day (Health Canada TRA V.1), 70 kg adult · Level in the food: 57.569 ng/g (mean (equal-weight of composites; 2000-2012 and 2016-2018 sets pooled by n), n = 16)
Measured on: Health Canada Total Diet Study, food GG11 'Lettuce (Iceburg and romaine)', as consumed, Canada: 13 composites 2000-2012 (mean 61.76 ng/g) and 3 composites 2016-2018 (39.41), pooled (13 x 61.76 + 3 x 39.41) / 16. Matched on the term 'lettuce'; a redundant CKAN pull of the 16 composites matched (7.8-149.0 ng/g). A CATEGORY item (iceberg and romaine together).
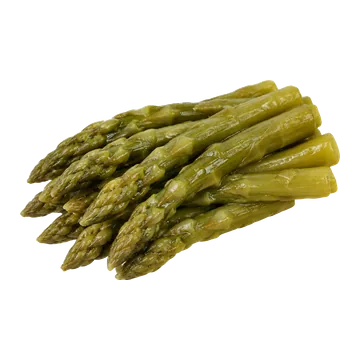 Asparagus, cooked
Nothing to watch: under the limit for a 85 g serving
980greaches the limit in a weekafter what an average adult already eats3,400 g eaten alone, from zeroEating it daily comes to 595 g a week, which stays within the 980 g of room left before the limit.4.43 µg per 85 g servingHealth Canada Total Diet Study, trace elements · grade A ?
How it’s rated
A daily serving adds 25% to an average adult's cadmium intake (EFSA 2012 adult median, 1.77 µg/kg body weight/week; Canadian adults in 2007: 1.2-1.75), far from doubling it, so no cap.
Intake: one 85 g serving a day, 70 kg adult · Level in the food: 52.07 µg/kg (mean (equal-weight of single-year composites), n = 11)
Measured on: Health Canada Total Diet Study trace elements, TDS food GG23 'Asparagus (Cooked asparagus)', as consumed, Canada; 11 single-year composites (2005-2012, 2016, 2017, 2018); non-detects stored as 0 (none occurred), so a lower bound
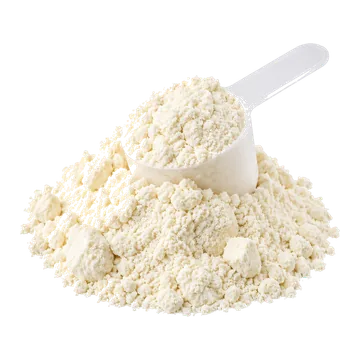 Whey protein concentrate
Nothing to watch: under the limit for a 30 g serving
1,000greaches the limit in a weekafter what an average adult already eats3,600 g eaten alone, from zeroEating it daily comes to 210 g a week, which stays within the 1,000 g of room left before the limit.1.46 µg per 30 g servingHow it’s rated
A daily serving adds 8.2% to an average adult's cadmium intake (EFSA 2012 adult median, 1.77 µg/kg body weight/week; Canadian adults in 2007: 1.2-1.75), far from doubling it, so no cap.
Intake: one 30 g serving a day, 70 kg adult · Level in the food: 0.049 ppm (mean (all samples, non-detects = 0), n = 196)
Measured on: CFIA targeted survey 'Toxic Metals in Selected Foods', April 2018 to March 2019, product 'Protein Powder' (ALL protein types, plant and rice included; whey cannot be separated), n = 196 samples in the open-data rows (the report counts 195): 72 domestic, 34 imported, 90 origin unknown; bought in Halifax, Montreal, Toronto, Ottawa, Vancouver, Calgary; results in µg/g (= ppm) 'as sold'. Mean recomputed from the CKAN rows with non-detects as 0 (lower bound); the report's own average uses quantifiable results only.
- Whey protein isolate
Nothing to watch: under the limit for a 30 g serving
1,000greaches the limit in a weekafter what an average adult already eats3,600 g eaten alone, from zeroEating it daily comes to 210 g a week, which stays within the 1,000 g of room left before the limit.1.46 µg per 30 g servingHow it’s rated
A daily serving adds 8.2% to an average adult's cadmium intake (EFSA 2012 adult median, 1.77 µg/kg body weight/week; Canadian adults in 2007: 1.2-1.75), far from doubling it, so no cap.
Intake: one 30 g serving a day, 70 kg adult · Level in the food: 0.049 ppm (mean (all samples, non-detects = 0), n = 196)
Measured on: CFIA targeted survey 'Toxic Metals in Selected Foods', April 2018 to March 2019, product 'Protein Powder' (ALL protein types, plant and rice included; whey cannot be separated), n = 196 samples in the open-data rows (the report counts 195): 72 domestic, 34 imported, 90 origin unknown; bought in Halifax, Montreal, Toronto, Ottawa, Vancouver, Calgary; results in µg/g (= ppm) 'as sold'. Mean recomputed from the CKAN rows with non-detects as 0 (lower bound); the report's own average uses quantifiable results only.
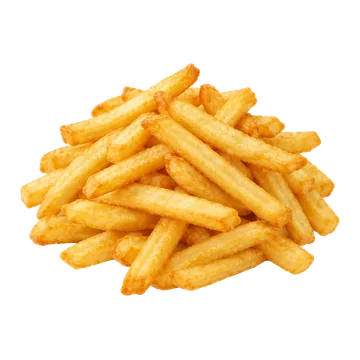 French fries, restaurant
Nothing to watch: under the limit for a 70 g serving
1,100greaches the limit in a weekafter what an average adult already eats3,900 g eaten alone, from zeroEating it daily comes to 490 g a week, which stays within the 1,100 g of room left before the limit.3.12 µg per 70 g servingHealth Canada Total Diet Study, trace elements · grade A ?
How it’s rated
A daily serving adds 18% to an average adult's cadmium intake (EFSA 2012 adult median, 1.77 µg/kg body weight/week; Canadian adults in 2007: 1.2-1.75), far from doubling it, so no cap.
Intake: one 70 g serving a day (Health Canada TRA P.1), 70 kg adult · Level in the food: 44.55 µg/kg (mean, n = 16)
Measured on: Health Canada Total Diet Study trace elements, TDS food NN02 'Fast Food, French Fries', 16 composites 2000-2018 (none for 2013-2015), As consumed, ICP-MS, none below detection limit (detection limit)
1 other measurement of this food
- US FDA TDS 2018-20, fast-food fries
Nothing to watch: under the limit
880greaches the limit in a weekafter what an average adult already eats3,000 g eaten alone, from zeroEating it daily comes to 490 g a week, which stays within the 880 g of room left before the limit.4.06 µg per 70 g servingUS FDA Total Diet Study (2018–2020) · grade A ?
How it’s rated
A daily serving adds 23% to an average adult's cadmium intake (EFSA 2012 adult median, 1.77 µg/kg body weight/week; Canadian adults in 2007: 1.2-1.75), far from doubling it, so no cap.
Intake: one 70 g serving a day (Health Canada TRA P.1), 70 kg adult · Level in the food: 58 µg/kg (mean, n = 27)
Measured on: US FDA Total Diet Study FY2018-FY2020, TDS food 258 'Potatoes, French fries, fast-food', 27 samples, 27 detects, RL 1 ppb, standard deviation 21, range 25-100
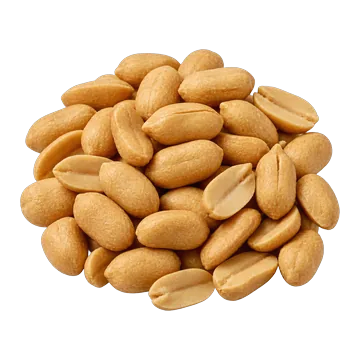 Peanuts, dry-roasted
Nothing to watch: under the limit for a 30 g serving
1,200greaches the limit in a weekafter what an average adult already eats4,300 g eaten alone, from zeroEating it daily comes to 210 g a week, which stays within the 1,200 g of room left before the limit.1.23 µg per 30 g servingUS FDA Total Diet Study (2018–2020) · grade A ?
How it’s rated
A daily serving adds 6.9% to an average adult's cadmium intake (EFSA 2012 adult median, 1.77 µg/kg body weight/week; Canadian adults in 2007: 1.2-1.75), far from doubling it, so no cap.
Intake: one 30 g serving a day, 70 kg adult · Level in the food: 41 µg/kg (mean, n = 3)
Measured on: food-specific: FDA TDS #48 "Peanuts, dry roasted, salted" (FY2018-2020; standard deviation 5.1; range 35-45; RL 1 µg/kg)
1 other measurement of this food
- Health Canada TDS 2000-18, peanuts and walnuts together
Nothing to watch: under the limit
910greaches the limit in a weekafter what an average adult already eats3,100 g eaten alone, from zeroEating it daily comes to 210 g a week, which stays within the 910 g of room left before the limit.1.68 µg per 30 g servingHealth Canada Total Diet Study, trace elements · grade B ?
How it’s rated
A daily serving adds 9.5% to an average adult's cadmium intake (EFSA 2012 adult median, 1.77 µg/kg body weight/week; Canadian adults in 2007: 1.2-1.75), far from doubling it, so no cap.
Intake: one 30 g serving a day, 70 kg adult · Level in the food: 55.9 µg/kg (mean, n = 16)
Measured on: category: Health Canada TDS food JJ12 "Nuts (Peanuts and walnuts)", 16 composites 2000-2018 (no 2013-2015), as consumed; the composite contains walnuts as well as peanuts
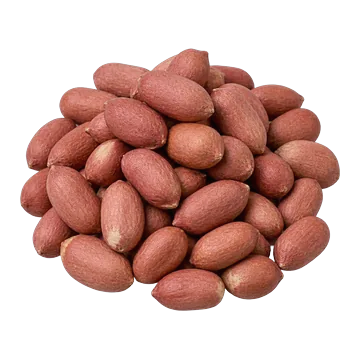 Peanuts, raw
Nothing to watch: under the limit for a 30 g serving
1,200greaches the limit in a weekafter what an average adult already eats4,300 g eaten alone, from zeroEating it daily comes to 210 g a week, which stays within the 1,200 g of room left before the limit.1.23 µg per 30 g servingUS FDA Total Diet Study (2018–2020) · grade A ?
How it’s rated
A daily serving adds 6.9% to an average adult's cadmium intake (EFSA 2012 adult median, 1.77 µg/kg body weight/week; Canadian adults in 2007: 1.2-1.75), far from doubling it, so no cap.
Intake: one 30 g serving a day, 70 kg adult · Level in the food: 41 µg/kg (mean, n = 3)
Measured on: food-specific: FDA TDS #48 "Peanuts, dry roasted, salted" (FY2018-2020; standard deviation 5.1; range 35-45; RL 1 µg/kg)
1 other measurement of this food
- Health Canada TDS 2000-18, peanuts and walnuts together
Nothing to watch: under the limit
910greaches the limit in a weekafter what an average adult already eats3,100 g eaten alone, from zeroEating it daily comes to 210 g a week, which stays within the 910 g of room left before the limit.1.68 µg per 30 g servingHealth Canada Total Diet Study, trace elements · grade B ?
How it’s rated
A daily serving adds 9.5% to an average adult's cadmium intake (EFSA 2012 adult median, 1.77 µg/kg body weight/week; Canadian adults in 2007: 1.2-1.75), far from doubling it, so no cap.
Intake: one 30 g serving a day, 70 kg adult · Level in the food: 55.9 µg/kg (mean, n = 16)
Measured on: category: Health Canada TDS food JJ12 "Nuts (Peanuts and walnuts)", 16 composites 2000-2018 (no 2013-2015), as consumed; the composite contains walnuts as well as peanuts
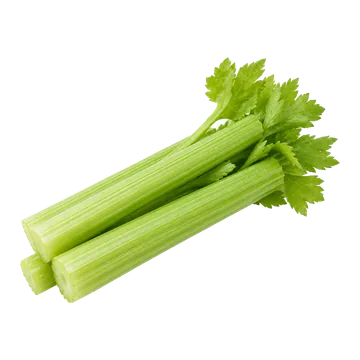 Celery, raw
Nothing to watch: under the limit for a 85 g serving
1,300greaches the limit in a weekafter what an average adult already eats4,600 g eaten alone, from zeroEating it daily comes to 595 g a week, which stays within the 1,300 g of room left before the limit.3.26 µg per 85 g servingHealth Canada Total Diet Study, trace elements · grade A ?
How it’s rated
A daily serving adds 18% to an average adult's cadmium intake (EFSA 2012 adult median, 1.77 µg/kg body weight/week; Canadian adults in 2007: 1.2-1.75), far from doubling it, so no cap.
Intake: one 85 g serving a day, 70 kg adult · Level in the food: 38.33 µg/kg (mean (equal-weight of composites; two sets pooled by n), n = 16)
Measured on: Health Canada Total Diet Study trace elements, TDS food GG08 'Celery (Cooked and raw celery)', as consumed, Canada; two composite sets pooled by n: 2000-2012 n 13 and 2016-2018 n 3 (n 16); non-detects stored as 0 so the mean is a lower bound
 Pasta, cooked
Go easy: can push past the limit for a 215 g serving
1,500greaches the limit in a weekafter what an average adult already eats5,100 g eaten alone, from zeroEating it daily comes to 1,505 g a week, which is more than the 1,500 g of room left before the limit.7.42 µg per 215 g servingHealth Canada Total Diet Study, trace elements · grade A ?
How it’s rated
The dataset’s original note, counted from zero and kept as written: A daily serving adds 42% to an average adult's cadmium intake (EFSA 2012 adult median, 1.77 µg/kg body weight/week; Canadian adults in 2007: 1.2-1.75), far from doubling it, so no cap.
Intake: one 215 g cooked serving a day, 70 kg adult · Level in the food: 34.52 µg/kg (mean, n = 16)
Measured on: food-specific: Health Canada TDS FF16 'Pasta, plain' (as consumed), 16 composites 2000-2018, all detected (detection limit (detection limit) 0 listed, none stored as non-detect), so lower and upper bounds coincide. Recent three (2016-2018) mean 25.65. FDA TDS FY2018-2020 #347 'Spaghetti, enriched, boiled' n = 3, mean 28 ppb (22-32); #540 'Pasta, whole wheat, cooked' mean 38 ppb (33-44)
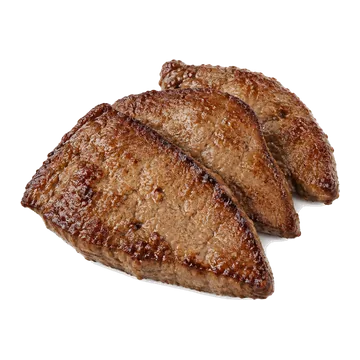 Beef liver, pan-fried
Nothing to watch: under the limit for a 100 g serving
1,500greaches the limit in a weekafter what an average adult already eats5,100 g eaten alone, from zeroEating it daily comes to 700 g a week, which stays within the 1,500 g of room left before the limit.3.408 µg per 100 g servingHealth Canada Total Diet Study, trace elements · grade A ?
How it’s rated
A daily serving adds 19% to an average adult's cadmium intake (EFSA 2012 adult median, 1.77 µg/kg body weight/week; Canadian adults in 2007: 1.2-1.75), far from doubling it, so no cap.
Intake: 100 g cooked serving (HC TRA L.6) · Level in the food: 34.08 ng/g (µg/kg) (mean (equal-weight over composites, both label eras pooled n-weighted), n = 16)
Measured on: Health Canada TDS trace elements, BB10 Organ meats (beef or veal liver), as consumed: 35.8 ng/g (13 composites, 2000-2012) and 26.64 ng/g (3 composites, 2016-2018, bilingual file); Canada
 Potato, baked
Nothing to watch: under the limit for a 110 g serving
1,500greaches the limit in a weekafter what an average adult already eats5,100 g eaten alone, from zeroEating it daily comes to 770 g a week, which stays within the 1,500 g of room left before the limit.3.74 µg per 110 g servingHealth Canada Total Diet Study, trace elements · grade A ?
How it’s rated
A daily serving adds 21% to an average adult's cadmium intake (EFSA 2012 adult median, 1.77 µg/kg body weight/week; Canadian adults in 2007: 1.2-1.75), far from doubling it, so no cap.
Intake: one 110 g serving a day, 70 kg adult · Level in the food: 34 µg/kg (mean, n = 9)
Measured on: food-specific: HC TDS GG26 'Potatoes, baked with skins', 9 composites 2007–2018
- Kale, cooked
Nothing to watch: under the limit for a 85 g serving
1,700greaches the limit in a weekafter what an average adult already eats5,800 g eaten alone, from zeroEating it daily comes to 595 g a week, which stays within the 1,700 g of room left before the limit.2.6 µg per 85 g servingUS FDA Total Diet Study (2018–2020) · grade A ?
How it’s rated
A daily serving adds 15% to an average adult's cadmium intake (EFSA 2012 adult median, 1.77 µg/kg body weight/week; Canadian adults in 2007: 1.2-1.75), far from doubling it, so no cap.
Intake: one 85 g serving a day, 70 kg adult · Level in the food: 30 µg/kg (mean, n = 6)
Measured on: food-specific: kale pan-cooked (FDA TDS #411)
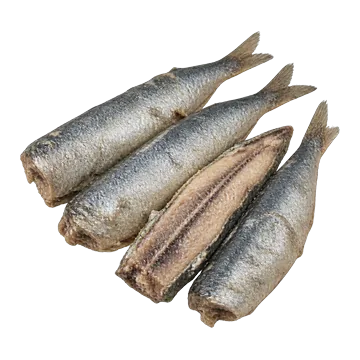 Sardines, canned in oil
Nothing to watch: under the limit for a 55 g serving
1,700greaches the limit in a weekafter what an average adult already eats5,800 g eaten alone, from zeroEating it daily comes to 385 g a week, which stays within the 1,700 g of room left before the limit.1.65 µg per 55 g servingCFIA mercury and metals in fish (2000–2021) · grade B ?
How it’s rated
A daily serving adds 9.3% to an average adult's cadmium intake (EFSA 2012 adult median, 1.77 µg/kg body weight/week; Canadian adults in 2007: 1.2-1.75), far from doubling it, so no cap. It is 6.6% of the EFSA tolerable weekly intake of 2.5 µg/kg body weight/week. Against EFSA's lifetime mean (2.04; P95 3.66) or the average of 2.3 a week in EFSA's news release, it adds 8.1% or 7.2%: no cap on any of them.
Intake: one 55 g serving a day, 70 kg adult · Level in the food: 30 µg/kg (single product, n = 1)
Measured on: food-specific: CFIA canned sardine (pilchard) meat, import, sampled 2020-11-18 (2020FFI-0000054451-4). Canadian TDS has no sardine composite; FDA TDS FY18-20 no sardine row
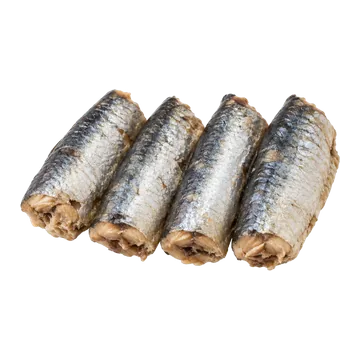 Sardines, canned in water
Nothing to watch: under the limit for a 55 g serving
1,700greaches the limit in a weekafter what an average adult already eats5,800 g eaten alone, from zeroEating it daily comes to 385 g a week, which stays within the 1,700 g of room left before the limit.1.65 µg per 55 g servingCFIA mercury and metals in fish (2000–2021) · grade B ?
How it’s rated
A daily serving adds 9.3% to an average adult's cadmium intake (EFSA 2012 adult median, 1.77 µg/kg body weight/week; Canadian adults in 2007: 1.2-1.75), far from doubling it, so no cap.
Intake: one 55 g serving a day, 70 kg adult · Level in the food: 30 µg/kg (single product, n = 1)
Measured on: food-specific: CFIA canned sardine (pilchard) meat, import, sampled 2020-11-18 (2020FFI-0000054451-4). Canadian TDS has no sardine composite; FDA TDS FY18-20 no sardine row
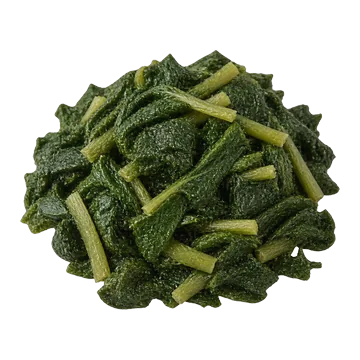 Turnip greens, cooked
Nothing to watch: under the limit for a 85 g serving
1,900greaches the limit in a weekafter what an average adult already eats6,500 g eaten alone, from zeroEating it daily comes to 595 g a week, which stays within the 1,900 g of room left before the limit.2.3 µg per 85 g servingUS FDA Total Diet Study (2018–2020) · grade B ?
How it’s rated
A daily serving adds 13% to an average adult's cadmium intake (EFSA 2012 adult median, 1.77 µg/kg body weight/week; Canadian adults in 2007: 1.2-1.75), far from doubling it, so no cap.
Intake: one 85 g serving a day, 70 kg adult · Level in the food: 27 µg/kg (mean, n = 27)
Measured on: related food: FDA TDS #108 'Collards, fresh/frozen, boiled' (no turnip greens in Health Canada's or FDA's Total Diet Study)
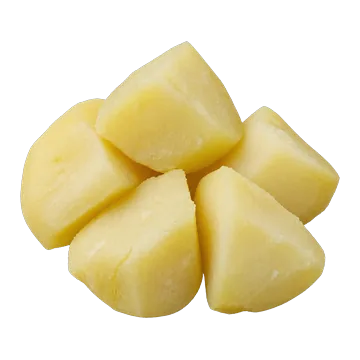 Potato, boiled
Nothing to watch: under the limit for a 110 g serving
1,900greaches the limit in a weekafter what an average adult already eats6,500 g eaten alone, from zeroEating it daily comes to 770 g a week, which stays within the 1,900 g of room left before the limit.2.96 µg per 110 g servingHealth Canada Total Diet Study, trace elements · grade A ?
How it’s rated
A daily serving adds 17% to an average adult's cadmium intake (EFSA 2012 adult median, 1.77 µg/kg body weight/week; Canadian adults in 2007: 1.2-1.75), far from doubling it, so no cap.
Intake: one 110 g serving a day, 70 kg adult · Level in the food: 26.9 µg/kg (mean, n = 16)
Measured on: food-specific: HC TDS GG16 'Potatoes, peeled and boiled', 16 composites 2000–2018
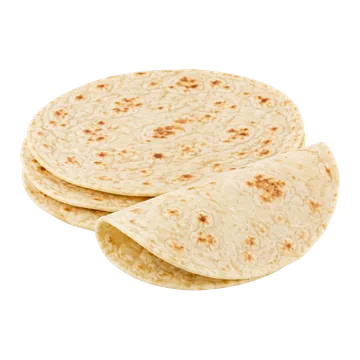 Flour tortillas
Nothing to watch: under the limit for a 55 g serving
2,000greaches the limit in a weekafter what an average adult already eats6,700 g eaten alone, from zeroEating it daily comes to 385 g a week, which stays within the 2,000 g of room left before the limit.1.43 µg per 55 g servingUS FDA Total Diet Study (2018–2020) · grade A ?
How it’s rated
A daily serving adds 8.1% to an average adult's cadmium intake (EFSA 2012 adult median, 1.77 µg/kg body weight/week; Canadian adults in 2007: 1.2-1.75), far from doubling it, so no cap.
Intake: one 55 g serving a day (HC TRA A.2), 70 kg adult · Level in the food: 26 ppb (mean (27 composites, all detected; standard deviation 3.9, min 17, max 31), n = 27)
Measured on: food-specific: US FDA Total Diet Study FY2018-2020 elements supplement, TDS food 63 'Tortilla, flour' (US, 27 samples; the table does not say how the tortillas were prepared or heated); Health Canada TDS has no tortilla code, so FDA is the headline and Canadian bread codes are related products
 Cookies
Nothing to watch: under the limit for a 30 g serving
2,000greaches the limit in a weekafter what an average adult already eats6,800 g eaten alone, from zeroEating it daily comes to 210 g a week, which stays within the 2,000 g of room left before the limit.0.773 µg per 30 g servingHealth Canada Total Diet Study, trace elements · grade A ?
How it’s rated
A daily serving adds 4.4% to an average adult's cadmium intake (EFSA 2012 adult median, 1.77 µg/kg body weight/week; Canadian adults in 2007: 1.2-1.75), far from doubling it, so no cap.
Intake: one 30 g reference serving a day (Health Canada TRA A.10), 70 kg adult · Level in the food: 25.772 ng/g (mean, n = 16)
Measured on: food-specific: Health Canada Total Diet Study FF09 'Cookies', 16 composites, 2000-2012 and 2016-2018, Canada, as consumed
 Crackers
Nothing to watch: under the limit for a 30 g serving
2,300greaches the limit in a weekafter what an average adult already eats8,000 g eaten alone, from zeroEating it daily comes to 210 g a week, which stays within the 2,300 g of room left before the limit.0.655 µg per 30 g servingHealth Canada Total Diet Study, trace elements · grade A ?
How it’s rated
A daily serving adds 3.7% to an average adult's cadmium intake (EFSA 2012 adult median, 1.77 µg/kg body weight/week; Canadian adults in 2007: 1.2-1.75), far from doubling it, so no cap.
Intake: one 30 g reference serving a day (Health Canada TRA A.12), 70 kg adult · Level in the food: 21.829 ng/g (mean, n = 16)
Measured on: food-specific: Health Canada Total Diet Study FF10 'Crackers (soda crackers)', 16 composites, 2000-2012 and 2016-2018, Canada, as consumed
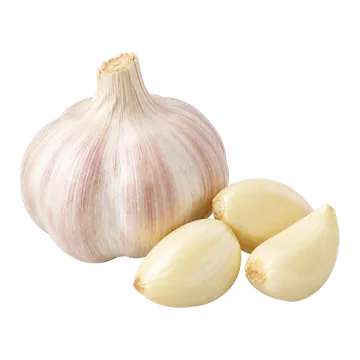 Garlic, raw
Nothing to watch: under the limit for a 4 g serving
More than anyone eatsNo realistic amount reaches the limit.Eating it daily comes to 28 g a week, which stays within the 2,400 g of room left before the limit.0.084 µg per 4 g servingUS FDA Total Diet Study (2018–2020) · grade A ?
How it’s rated
The counted figure is 2,400 g a week, about 87 servings a day.
A daily serving adds 0.47% to an average adult's cadmium intake (EFSA 2012 adult median, 1.77 µg/kg body weight/week; Canadian adults in 2007: 1.2-1.75), far from doubling it, so no cap.
Intake: one 4.0 g serving a day (a clove), 70 kg adult · Level in the food: 21 ppb (mean, n = 6)
Measured on: FDA Total Diet Study FY2018-2020, TDS food 413 'Garlic, raw', US, 6 samples, all detected, range 7.9-40 ppb (standard deviation 14). Health Canada's TDS has no garlic food code (term search 0 records); no Canadian TDS row.
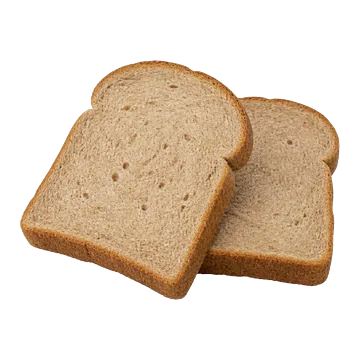 Whole-wheat bread
Nothing to watch: under the limit for a 75 g serving
2,500greaches the limit in a weekafter what an average adult already eats8,400 g eaten alone, from zeroEating it daily comes to 525 g a week, which stays within the 2,500 g of room left before the limit.1.56 µg per 75 g servingHealth Canada Total Diet Study, trace elements · grade A ?
How it’s rated
A daily serving adds 8.8% to an average adult's cadmium intake (EFSA 2012 adult median, 1.77 µg/kg body weight/week; Canadian adults in 2007: 1.2-1.75), far from doubling it, so no cap.
Intake: one 75 g serving a day, 70 kg adult · Level in the food: 20.83 µg/kg (mean, n = 16)
Measured on: food-specific: HC TDS FF02 'Bread, whole wheat', 16 composites 2000-2018 (equal-weight mean); 0 of 16 non-detects, so lower = upper bound
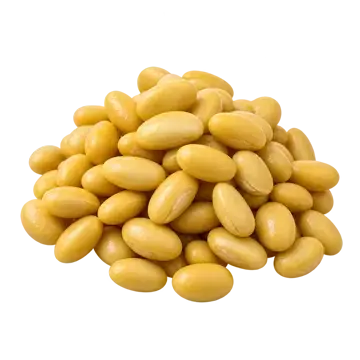 Soybeans, cooked
Nothing to watch: under the limit for a 91 g serving
2,500greaches the limit in a weekafter what an average adult already eats8,500 g eaten alone, from zeroEating it daily comes to 636 g a week, which stays within the 2,500 g of room left before the limit.1.86 µg per 91 g servingHow it’s rated
A daily serving adds 11% to an average adult's cadmium intake (EFSA 2012 adult median, 1.77 µg/kg body weight/week; Canadian adults in 2007: 1.2-1.75), far from doubling it, so no cap.
Intake: one 91 g serving a day, 70 kg adult · Level in the food: 20.5 µg/kg (mean, n = 2267)
Measured on: category: Legumes dried (EFSA 2012); dry-bean concentration on cooked weight errs high
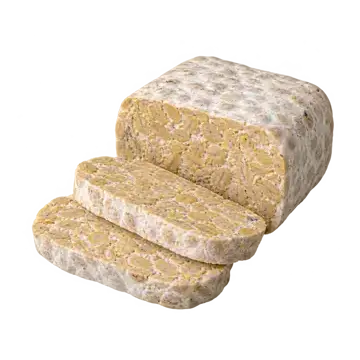 Tempeh
Nothing to watch: under the limit for a 85 g serving
2,500greaches the limit in a weekafter what an average adult already eats8,500 g eaten alone, from zeroEating it daily comes to 595 g a week, which stays within the 2,500 g of room left before the limit.1.74 µg per 85 g servingHow it’s rated
A daily serving adds 9.8% to an average adult's cadmium intake (EFSA 2012 adult median, 1.77 µg/kg body weight/week; Canadian adults in 2007: 1.2-1.75), far from doubling it, so no cap.
Intake: one 85 g serving a day, 70 kg adult · Level in the food: 20.5 µg/kg (mean, n = 2267)
Measured on: category: Legumes dried (soybeans' category; tempeh not listed); errs high
 Tomatoes, canned
Nothing to watch: under the limit for a 125 g serving
2,700greaches the limit in a weekafter what an average adult already eats9,300 g eaten alone, from zeroEating it daily comes to 875 g a week, which stays within the 2,700 g of room left before the limit.2.365 µg per 125 g servingHealth Canada Total Diet Study, trace elements · grade B ?
How it’s rated
A daily serving adds 13% to an average adult's cadmium intake (EFSA 2012 adult median, 1.77 µg/kg body weight/week; Canadian adults in 2007: 1.2-1.75), far from doubling it, so no cap.
Intake: one 125 mL serving a day (Health Canada V.1; 125 g by the 1 g/mL convention), 70 kg adult · Level in the food: 18.9 µg/kg (mean (equal-weight), n = 16)
Measured on: category: HC TDS GG21 "Tomatoes, canned, and tomato sauce, canned", 16 composites 2000-2018 (canned whole/chopped tomatoes pooled with canned tomato sauce)
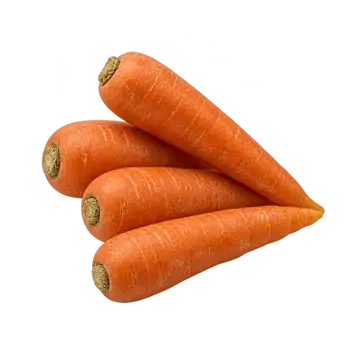 Carrots, raw
Nothing to watch: under the limit for a 85 g serving
2,800greaches the limit in a weekafter what an average adult already eats9,600 g eaten alone, from zeroEating it daily comes to 595 g a week, which stays within the 2,800 g of room left before the limit.1.6 µg per 85 g servingHealth Canada Total Diet Study, trace elements · grade A ?
How it’s rated
A daily serving adds 9% to an average adult's cadmium intake (EFSA 2012 adult median, 1.77 µg/kg body weight/week; Canadian adults in 2007: 1.2-1.75), far from doubling it, so no cap.
Intake: one 85 g serving a day, 70 kg adult · Level in the food: 18.3 µg/kg (mean, n = 16)
Measured on: food-specific: HC TDS GG06
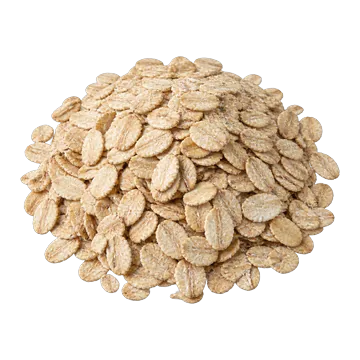 Rolled oats, dry
Nothing to watch: under the limit for a 40 g serving
3,100greaches the limit in a weekafter what an average adult already eats11,000 g eaten alone, from zeroEating it daily comes to 280 g a week, which stays within the 3,100 g of room left before the limit.0.66 µg per 40 g servingCFIA 2016–2017 · grade A ?
How it’s rated
A daily serving adds 3.7% to an average adult's cadmium intake (EFSA 2012 adult median, 1.77 µg/kg body weight/week; Canadian adults in 2007: 1.2-1.75), far from doubling it, so no cap.
Intake: one 40 g dry serving a day, 70 kg adult · Level in the food: 16.54 µg/kg (mean, n = 100)
Measured on: food-specific: CFIA 'Oatmeal' (Flocons d'avoine), dry as sold, Pesticides and Metals in Grain Products 2016-17 (52 import, 6 domestic, 42 unknown origin)
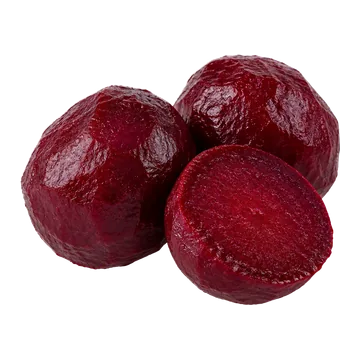 Beets, cooked
Nothing to watch: under the limit for a 85 g serving
3,100greaches the limit in a weekafter what an average adult already eats11,000 g eaten alone, from zeroEating it daily comes to 595 g a week, which stays within the 3,100 g of room left before the limit.1.4 µg per 85 g servingHealth Canada Total Diet Study, trace elements · grade A ?
How it’s rated
A daily serving adds 7.9% to an average adult's cadmium intake (EFSA 2012 adult median, 1.77 µg/kg body weight/week; Canadian adults in 2007: 1.2-1.75), far from doubling it, so no cap.
Intake: one 85 g serving a day, 70 kg adult · Level in the food: 16.47 µg/kg (mean (equal-weight of single-year composites), n = 16)
Measured on: Health Canada Total Diet Study trace elements, TDS food GG03 'Beets (Pickled, canned, and fresh cooked)', as consumed, Canada; 16 single-year composites 2000-2012 and 2016-2018 (years 2000-2012, 2016, 2017, 2018); non-detects stored as 0 (none occurred), so a lower bound. The GG03 composite mixes pickled, canned and fresh cooked beets; it is not boiled beets alone.
 Milk chocolate
Nothing to watch: under the limit for a 40 g serving
3,200greaches the limit in a weekafter what an average adult already eats11,000 g eaten alone, from zeroEating it daily comes to 280 g a week, which stays within the 3,200 g of room left before the limit.0.63 µg per 40 g servingHealth Canada Total Diet Study, trace elements · grade A ?
How it’s rated
A daily serving adds 3.6% to an average adult's cadmium intake (EFSA 2012 adult median, 1.77 µg/kg body weight/week; Canadian adults in 2007: 1.2-1.75), far from doubling it, so no cap.
Intake: one 40 g serving a day, 70 kg adult (Health Canada TRA U.1, 40 g) · Level in the food: 15.767 µg/kg (mean, n = 15)
Measured on: Health Canada Total Diet Study, trace elements, food code JJ01 'Chocolate bars (Plain chocolate bars)'; the TDS does not state the bar type (milk or dark) and does not state the cocoa share. 15 composites (one per city-year: 2000-2007, 2009-2012, 2016-2018), as consumed, all detected, so lower, middle and upper bounds coincide. Canada.
3 other measurements of this food
- Serbia 2024, 98 milk chocolates (30-50% cacao)
Nothing to watch: under the limit
1,800greaches the limit in a weekafter what an average adult already eats6,300 g eaten alone, from zeroEating it daily comes to 280 g a week, which stays within the 1,800 g of room left before the limit.1.12 µg per 40 g servingSerbia 2024 · grade B ?
How it’s rated
A daily serving adds 6.3% to an average adult's cadmium intake (EFSA 2012 adult median, 1.77 µg/kg body weight/week; Canadian adults in 2007: 1.2-1.75), far from doubling it, so no cap.
Intake: one 40 g serving a day, 70 kg adult (Health Canada TRA U.1, 40 g) · Level in the food: 28 µg/kg (mean, n = 98)
Measured on: Serbia 2024 (Nesic et al., Foods 14:18): 98 retail milk chocolates, cacao ≥30% and <50%, Belgrade market, bought Mar-Jun 2022; ICP-MS; mean 0.028 mg/kg (median 0.023, min 0.010, max 0.17).
- US FDA TDS 2018-20, plain milk chocolate bar
Nothing to watch: under the limit
2,600greaches the limit in a weekafter what an average adult already eats8,800 g eaten alone, from zeroEating it daily comes to 280 g a week, which stays within the 2,600 g of room left before the limit.0.8 µg per 40 g servingUS FDA Total Diet Study (2018–2020) · grade A ?
How it’s rated
A daily serving adds 4.5% to an average adult's cadmium intake (EFSA 2012 adult median, 1.77 µg/kg body weight/week; Canadian adults in 2007: 1.2-1.75), far from doubling it, so no cap.
Intake: one 40 g serving a day, 70 kg adult (Health Canada TRA U.1, 40 g) · Level in the food: 20 µg/kg (mean, n = 3)
Measured on: US FDA Total Diet Study FY2018-2020, food #187 'Candy bar, milk chocolate, plain', 3 composites, 3 of 3 detected (reporting limit 1 ppb), as sold in the US.
- EFSA 2012, European milk chocolate
Nothing to watch: under the limit
2,600greaches the limit in a weekafter what an average adult already eats8,900 g eaten alone, from zeroEating it daily comes to 280 g a week, which stays within the 2,600 g of room left before the limit.0.78 µg per 40 g servingHow it’s rated
A daily serving adds 4.4% to an average adult's cadmium intake (EFSA 2012 adult median, 1.77 µg/kg body weight/week; Canadian adults in 2007: 1.2-1.75), far from doubling it, so no cap.
Intake: one 40 g serving a day, 70 kg adult (Health Canada TRA U.1, 40 g) · Level in the food: 19.6 µg/kg (mean, n = 184)
Measured on: EFSA 2012 (EFSA J 10(1):2551) Table 2, FoodEx level 3 'Milk chocolate' (shown split from 'Chocolate'); N = 184 analytical results; results submitted by European countries, mainly 2003-2011; mean µg/kg: lower bound 18.7, MB 19.6, upper bound 20.6. Europe (not Canada).
 Light tuna, canned in water
Nothing to watch: under the limit for a 55 g serving
3,300greaches the limit in a weekafter what an average adult already eats11,000 g eaten alone, from zeroEating it daily comes to 385 g a week, which stays within the 3,300 g of room left before the limit.0.85 µg per 55 g servingCFIA mercury and metals in fish (2000–2021) · grade A ?
How it’s rated
A daily serving adds 4.8% to an average adult's cadmium intake (EFSA 2012 adult median, 1.77 µg/kg body weight/week; Canadian adults in 2007: 1.2-1.75), far from doubling it, so no cap.
Intake: one 55 g serving a day, 70 kg adult · Level in the food: 15.5 µg/kg (mean, n = 46)
Measured on: food-specific: CFIA canned skipjack (41) + yellowfin (5), 2004-2020; resolution 0.01 ppm. Beside it: Health Canada TDS DD03 tuna+salmon equal-weight mean 10.76 µg/kg (16 composites 2000-2018; 2016-18 mean 12.6); FDA TDS FY18-20 canned in water 25 µg/kg (n=3, 21-34)
 Almonds, raw
Nothing to watch: under the limit for a 30 g serving
3,400greaches the limit in a weekafter what an average adult already eats12,000 g eaten alone, from zeroEating it daily comes to 210 g a week, which stays within the 3,400 g of room left before the limit.0.45 µg per 30 g servingUS FDA Total Diet Study (2018–2020) · grade A ?
How it’s rated
A daily serving adds 2.5% to an average adult's cadmium intake (EFSA 2012 adult median, 1.77 µg/kg body weight/week; Canadian adults in 2007: 1.2-1.75), far from doubling it, so no cap.
Intake: one 30 g serving a day, 70 kg adult · Level in the food: 15 µg/kg (mean, n = 3)
Measured on: food-specific: FDA TDS #526 'Almonds, shelled' (all 3 detected; range 5-21, standard deviation 8.7, RL 1). Health Canada TDS has NO almond composite
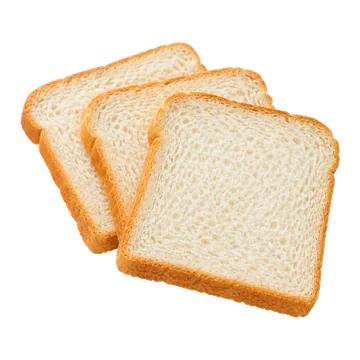 White bread
Nothing to watch: under the limit for a 75 g serving
3,400greaches the limit in a weekafter what an average adult already eats12,000 g eaten alone, from zeroEating it daily comes to 525 g a week, which stays within the 3,400 g of room left before the limit.1.119 µg per 75 g servingHealth Canada Total Diet Study, trace elements · grade A ?
How it’s rated
A daily serving adds 6.3% to an average adult's cadmium intake (EFSA 2012 adult median, 1.77 µg/kg body weight/week; Canadian adults in 2007: 1.2-1.75), far from doubling it, so no cap.
Intake: one 75 g reference serving a day (Health Canada TRA A.1), 70 kg adult · Level in the food: 14.918 ng/g (mean, n = 16)
Measured on: food-specific: Health Canada Total Diet Study FF01 'Bread, white', 16 composites, 2000-2012 and 2016-2018, Canada, as consumed
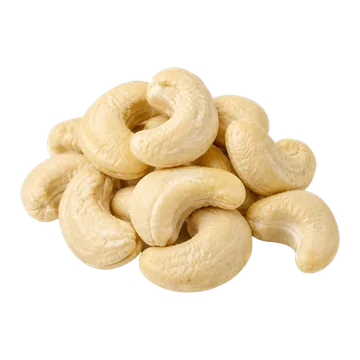 Cashews, raw
Nothing to watch: under the limit for a 30 g serving
3,900greaches the limit in a weekafter what an average adult already eats13,000 g eaten alone, from zeroEating it daily comes to 210 g a week, which stays within the 3,900 g of room left before the limit.0.4 µg per 30 g servingBielecka 2021 · grade B ?
How it’s rated
A daily serving adds 2.3% to an average adult's cadmium intake (EFSA 2012 adult median, 1.77 µg/kg body weight/week; Canadian adults in 2007: 1.2-1.75), far from doubling it, so no cap.
Intake: 30 g shelled serving (HC TRA O.1) · Level in the food: 13.25 µg/kg (mean ± standard deviation 13.25 ± 28.51 (range 1.05-99.14; median 2.46, Q1-Q3 1.27-5.44), n = 10)
Measured on: Polish retail survey (Bielecka 2021), cashews, 10 samples, GFAAS with detection limit (detection limit) 0.02 µg/kg for Cd; weight basis not stated; Poland
 Cakes
Nothing to watch: under the limit for a 80 g serving
4,200greaches the limit in a weekafter what an average adult already eats15,000 g eaten alone, from zeroEating it daily comes to 560 g a week, which stays within the 4,200 g of room left before the limit.0.963 µg per 80 g servingHealth Canada Total Diet Study, trace elements · grade A ?
How it’s rated
A daily serving adds 5.4% to an average adult's cadmium intake (EFSA 2012 adult median, 1.77 µg/kg body weight/week; Canadian adults in 2007: 1.2-1.75), far from doubling it, so no cap.
Intake: one 80 g reference serving a day (Health Canada TRA A.6), 70 kg adult · Level in the food: 12.033 ng/g (mean, n = 16)
Measured on: food-specific: Health Canada Total Diet Study FF04 'Cake (Cake with icing)', 16 composites, 2000-2012 and 2016-2018, Canada, as consumed
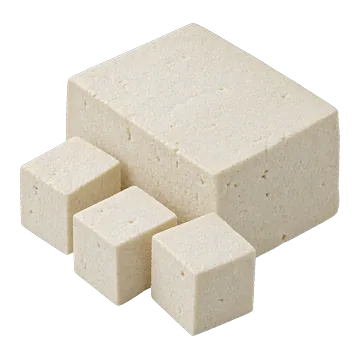 Tofu, calcium-set
Nothing to watch: under the limit for a 85 g serving
4,300greaches the limit in a weekafter what an average adult already eats15,000 g eaten alone, from zeroEating it daily comes to 595 g a week, which stays within the 4,300 g of room left before the limit.1.02 µg per 85 g servingUS FDA Total Diet Study (2018–2020) · grade B ?
How it’s rated
A daily serving adds 5.8% to an average adult's cadmium intake (EFSA 2012 adult median, 1.77 µg/kg body weight/week; Canadian adults in 2007: 1.2-1.75), far from doubling it, so no cap.
Intake: one 85 g serving a day, 70 kg adult · Level in the food: 12 µg/kg (single composite, n = 1)
Measured on: food-specific: FDA TDS FY2018-2020 #547 'Tofu, firm, plain, drained' (1 sample); Canadian TDS has no tofu composite; EFSA 2012 tofu row blocked (Wiley 403)
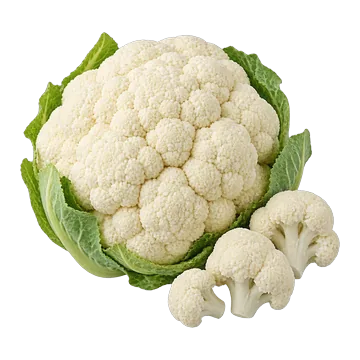 Cauliflower, raw
Nothing to watch: under the limit for a 85 g serving
4,300greaches the limit in a weekafter what an average adult already eats15,000 g eaten alone, from zeroEating it daily comes to 595 g a week, which stays within the 4,300 g of room left before the limit.1.01 µg per 85 g servingHealth Canada Total Diet Study, trace elements · grade A ?
How it’s rated
A daily serving adds 5.7% to an average adult's cadmium intake (EFSA 2012 adult median, 1.77 µg/kg body weight/week; Canadian adults in 2007: 1.2-1.75), far from doubling it, so no cap.
Intake: one 85 g serving a day, 70 kg adult · Level in the food: 11.86 µg/kg (mean, n = 16)
Measured on: food-specific: HC TDS GG07 'Cauliflowers (Cooked and raw cauliflower)', 16 composites 2000-2018, equal weight; cooked and raw mixed, so one value serves both preparations
1 other measurement of this food
- US FDA TDS 2018-20, boiled cauliflower
Nothing to watch: under the limit
4,300greaches the limit in a weekafter what an average adult already eats15,000 g eaten alone, from zeroEating it daily comes to 595 g a week, which stays within the 4,300 g of room left before the limit.1.02 µg per 85 g servingUS FDA Total Diet Study (2018–2020) · grade A ?
How it’s rated
A daily serving adds 5.8% to an average adult's cadmium intake (EFSA 2012 adult median, 1.77 µg/kg body weight/week; Canadian adults in 2007: 1.2-1.75), far from doubling it, so no cap.
Intake: one 85 g serving a day, 70 kg adult · Level in the food: 12 µg/kg (mean, n = 27)
Measured on: food-specific: FDA TDS #116 'Cauliflower, fresh/frozen, boiled' (shown beside the Canadian value, not the rating basis)
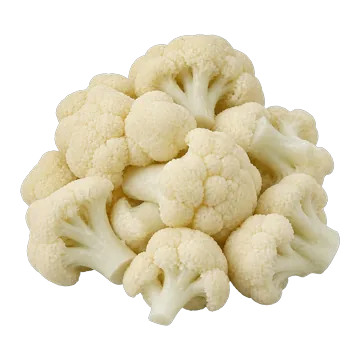 Cauliflower, cooked
Nothing to watch: under the limit for a 85 g serving
4,300greaches the limit in a weekafter what an average adult already eats15,000 g eaten alone, from zeroEating it daily comes to 595 g a week, which stays within the 4,300 g of room left before the limit.1.01 µg per 85 g servingHealth Canada Total Diet Study, trace elements · grade A ?
How it’s rated
A daily serving adds 5.7% to an average adult's cadmium intake (EFSA 2012 adult median, 1.77 µg/kg body weight/week; Canadian adults in 2007: 1.2-1.75), far from doubling it, so no cap.
Intake: one 85 g serving a day, 70 kg adult · Level in the food: 11.86 µg/kg (mean, n = 16)
Measured on: food-specific: HC TDS GG07 'Cauliflowers (Cooked and raw cauliflower)', 16 composites 2000-2018, equal weight; cooked and raw mixed, so one value serves both preparations
1 other measurement of this food
- US FDA TDS 2018-20, boiled cauliflower
Nothing to watch: under the limit
4,300greaches the limit in a weekafter what an average adult already eats15,000 g eaten alone, from zeroEating it daily comes to 595 g a week, which stays within the 4,300 g of room left before the limit.1.02 µg per 85 g servingUS FDA Total Diet Study (2018–2020) · grade A ?
How it’s rated
A daily serving adds 5.8% to an average adult's cadmium intake (EFSA 2012 adult median, 1.77 µg/kg body weight/week; Canadian adults in 2007: 1.2-1.75), far from doubling it, so no cap.
Intake: one 85 g serving a day, 70 kg adult · Level in the food: 12 µg/kg (mean, n = 27)
Measured on: food-specific: FDA TDS #116 'Cauliflower, fresh/frozen, boiled' (shown beside the Canadian value, not the rating basis)
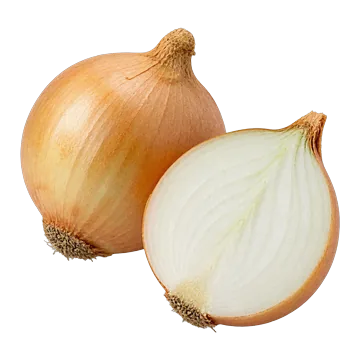 Onions, raw
Nothing to watch: under the limit for a 85 g serving
4,600greaches the limit in a weekafter what an average adult already eats16,000 g eaten alone, from zeroEating it daily comes to 595 g a week, which stays within the 4,600 g of room left before the limit.0.94 µg per 85 g servingHealth Canada Total Diet Study, trace elements · grade A ?
How it’s rated
A daily serving adds 5.3% to an average adult's cadmium intake (EFSA 2012 adult median, 1.77 µg/kg body weight/week; Canadian adults in 2007: 1.2-1.75), far from doubling it, so no cap.
Intake: one 85 g serving a day (Health Canada V.1), 70 kg adult · Level in the food: 11.02 µg/kg (mean (equal-weight), n = 16)
Measured on: food-specific: HC TDS GG13 'Onions (Raw Onion)', 16 composites 2000-2018, sampled 'As consumed' (no mixed-food composite: onion has its own code)
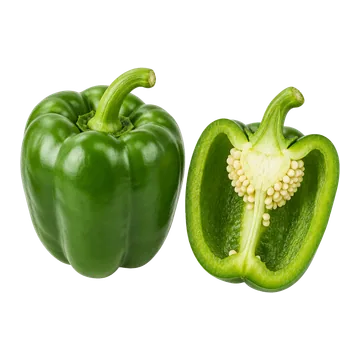 Green pepper, raw
Nothing to watch: under the limit for a 85 g serving
4,600greaches the limit in a weekafter what an average adult already eats16,000 g eaten alone, from zeroEating it daily comes to 595 g a week, which stays within the 4,600 g of room left before the limit.0.936 µg per 85 g servingHealth Canada Total Diet Study, trace elements · grade A ?
How it’s rated
A daily serving adds 5.3% to an average adult's cadmium intake (EFSA 2012 adult median, 1.77 µg/kg body weight/week; Canadian adults in 2007: 1.2-1.75), far from doubling it, so no cap.
Intake: one 85 g serving a day (Health Canada TRA V.1), 70 kg adult · Level in the food: 11.014 ng/g (mean (equal-weight of composites; 2000-2012 and 2016-2018 sets pooled by n), n = 16)
Measured on: Health Canada Total Diet Study, food GG15 'Peppers (Raw, green pepper)', as consumed, Canada: 13 composites 2000-2012 (mean 9.723 ng/g) and 3 composites 2016-2018 (16.61), pooled (13 x 9.723 + 3 x 16.61) / 16. Matched on the term 'pepper'; PP06 'Herbs and spices (Pepper, oregano, ...)' is black pepper and NOT used. Composite range 2.48-35.9 ng/g.
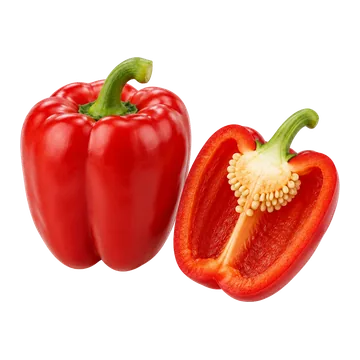 Red pepper, raw
Nothing to watch: under the limit for a 85 g serving
4,600greaches the limit in a weekafter what an average adult already eats16,000 g eaten alone, from zeroEating it daily comes to 595 g a week, which stays within the 4,600 g of room left before the limit.0.936 µg per 85 g servingHealth Canada Total Diet Study, trace elements · grade B ?
How it’s rated
A daily serving adds 5.3% to an average adult's cadmium intake (EFSA 2012 adult median, 1.77 µg/kg body weight/week; Canadian adults in 2007: 1.2-1.75), far from doubling it, so no cap.
Intake: one 85 g serving a day (Health Canada TRA V.1), 70 kg adult · Level in the food: 11.014 ng/g (mean (equal-weight of composites; 2000-2012 and 2016-2018 sets pooled by n), n = 16)
Measured on: Health Canada Total Diet Study, food GG15 'Peppers (Raw, green pepper)', as consumed, Canada: 13 composites 2000-2012 (mean 9.723 ng/g) and 3 composites 2016-2018 (16.61), pooled (13 x 9.723 + 3 x 16.61) / 16. Matched on the term 'pepper'; PP06 'Herbs and spices (Pepper, oregano, ...)' is black pepper and NOT used. Composite range 2.48-35.9 ng/g.
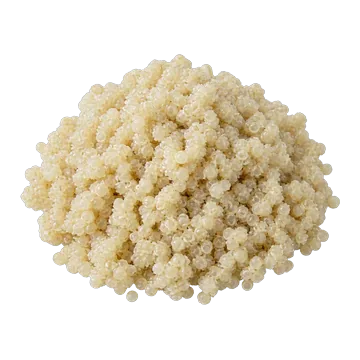 Quinoa, cooked
Nothing to watch: under the limit for a 140 g serving
4,600greaches the limit in a weekafter what an average adult already eats16,000 g eaten alone, from zeroEating it daily comes to 980 g a week, which stays within the 4,600 g of room left before the limit.1.54 µg per 140 g servingUS FDA Total Diet Study (2018–2020) · grade A ?
How it’s rated
A daily serving adds 8.7% to an average adult's cadmium intake (EFSA 2012 adult median, 1.77 µg/kg body weight/week; Canadian adults in 2007: 1.2-1.75), far from doubling it, so no cap.
Intake: one 140 g cooked serving a day, 70 kg adult · Level in the food: 11 µg/kg (mean, n = 3)
Measured on: food-specific agency data: FDA TDS FY2018-2020 #522 'Quinoa, cooked', 3 composites
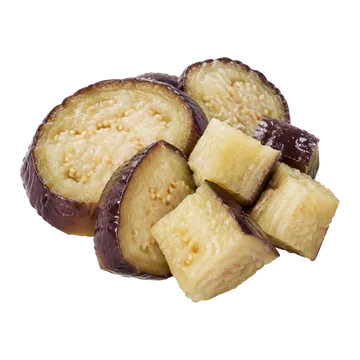 Eggplant, cooked
Nothing to watch: under the limit for a 85 g serving
4,600greaches the limit in a weekafter what an average adult already eats16,000 g eaten alone, from zeroEating it daily comes to 595 g a week, which stays within the 4,600 g of room left before the limit.0.935 µg per 85 g servingUS FDA Total Diet Study (2018–2020) · grade A ?
How it’s rated
A daily serving adds 5.3% to an average adult's cadmium intake (EFSA 2012 adult median, 1.77 µg/kg body weight/week; Canadian adults in 2007: 1.2-1.75), far from doubling it, so no cap.
Intake: one 85 g serving a day (HC TRA V.1), 70 kg adult · Level in the food: 11 µg/kg (mean (standard deviation 6, range 4.4-18, 6 of 6 detects, reporting limit 1 ppb), n = 6)
Measured on: US FDA Total Diet Study FY2018-FY2020, TDS food 265 "Eggplant, fresh, peeled, boiled", n 6 samples, United States. COOKED basis (boiled, peeled). The summary prints mean N/A when every sample is a non-detect and does not state how non-detects enter a partial mean.
1 other measurement of this food
- CFIA 2016-23, raw eggplant
Nothing to watch: under the limit
5,000greaches the limit in a weekafter what an average adult already eats17,000 g eaten alone, from zeroEating it daily comes to 595 g a week, which stays within the 5,000 g of room left before the limit.0.874 µg (raw basis) per 85 g servingCFIA chemical residue monitoring (2016–2023) · grade B ?
How it’s rated
A daily serving adds 4.9% to an average adult's cadmium intake (EFSA 2012 adult median, 1.77 µg/kg body weight/week; Canadian adults in 2007: 1.2-1.75), far from doubling it, so no cap.
Intake: one 85 g serving a day (HC TRA V.1), 70 kg adult · Level in the food: 10.28 µg/kg (lower-bound mean over all n, pooled by n (6 annex sets), n = 124)
Measured on: CFIA National Chemical Residue Monitoring Program metals, RAW fresh eggplant (commodity "Eggplant"), Annex B1 domestic and B2 import pooled by n over 6 annex sets: 2016-17 to 2018-19 [ppm], 2019-20 to 2021-22 [ppm], 2022-23 [µg/g]; Canada. Statistic: lower-bound mean over all n (non-detects as 0), recomputed from each set's n x lower bound mean. RAW BASIS: not a boiled-eggplant figure; no cooked-basis metals source exists (no TDS code, not in FDA TDS FY2018-20).
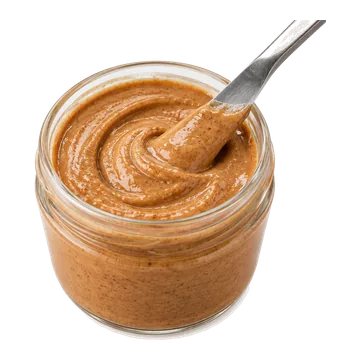 Almond butter
Nothing to watch: under the limit for a 15 g serving
4,700greaches the limit in a weekafter what an average adult already eats16,000 g eaten alone, from zeroEating it daily comes to 105 g a week, which stays within the 4,700 g of room left before the limit.0.162 µg (15 g × 10.8 µg/kg) per 15 g servingCFIA chemical residue monitoring (2016–2023) · grade B ?
How it’s rated
A daily serving adds 0.92% to an average adult's cadmium intake (EFSA 2012 adult median, 1.77 µg/kg body weight/week; Canadian adults in 2007: 1.2-1.75), far from doubling it, so no cap.
Intake: one 15.0 g serving a day, 70 kg adult · Level in the food: 10.8 µg/kg (lower-bound mean over all n, n-weighted over three CFIA lines (FSO 71, imports 19, domestic 7); 78 of 97 positive, n = 97)
Measured on: CFIA NCRMP 'Nut - Almond' (whole almonds, not butter), annex B6 FSO 2016-17 to 2020-21 (n 71), B2 imports 2021-23 (n 19), B1 domestic 2021-23 (n 7); max 50 µg/kg
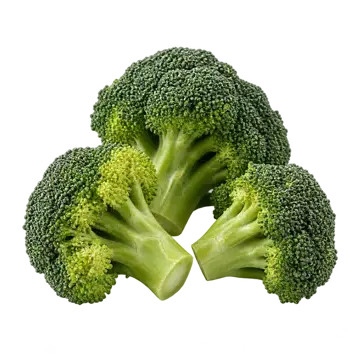 Broccoli, raw
Nothing to watch: under the limit for a 85 g serving
4,900greaches the limit in a weekafter what an average adult already eats17,000 g eaten alone, from zeroEating it daily comes to 595 g a week, which stays within the 4,900 g of room left before the limit.0.9 µg per 85 g servingHealth Canada Total Diet Study, trace elements · grade A ?
How it’s rated
A daily serving adds 5.1% to an average adult's cadmium intake (EFSA 2012 adult median, 1.77 µg/kg body weight/week; Canadian adults in 2007: 1.2-1.75), far from doubling it, so no cap.
Intake: one 85 g serving a day, 70 kg adult · Level in the food: 10.5 µg/kg (mean, n = 16)
Measured on: food-specific: HC TDS GG04
- Broccoli, cooked
Nothing to watch: under the limit for a 85 g serving
4,900greaches the limit in a weekafter what an average adult already eats17,000 g eaten alone, from zeroEating it daily comes to 595 g a week, which stays within the 4,900 g of room left before the limit.0.9 µg per 85 g servingHealth Canada Total Diet Study, trace elements · grade B ?
How it’s rated
A daily serving adds 5% to an average adult's cadmium intake (EFSA 2012 adult median, 1.77 µg/kg body weight/week; Canadian adults in 2007: 1.2-1.75), far from doubling it, so no cap.
Intake: one 85 g serving a day, 70 kg adult · Level in the food: 10.5 µg/kg (mean, n = 16)
Measured on: food-specific: HC TDS GG04
1 other measurement of this food
- US FDA TDS 2018-20, 27 samples
Nothing to watch: under the limit
3,200greaches the limit in a weekafter what an average adult already eats11,000 g eaten alone, from zeroEating it daily comes to 595 g a week, which stays within the 3,200 g of room left before the limit.1.36 µg per 85 g servingUS FDA Total Diet Study (2018–2020) · grade A ?
How it’s rated
A daily serving adds 7.7% to an average adult's cadmium intake (EFSA 2012 adult median, 1.77 µg/kg body weight/week; Canadian adults in 2007: 1.2-1.75), far from doubling it, so no cap.
Intake: one 85 g serving a day (Health Canada TRA V.1), 70 kg adult · Level in the food: 16 µg/kg (mean, n = 27)
Measured on: US FDA Total Diet Study FY2018-2020, TDS food 113 'Broccoli, fresh/frozen, boiled': 27 samples, 27 detects, mean 16 ppb, standard deviation 16, min 3.9, max 84, reporting limit 1 ppb
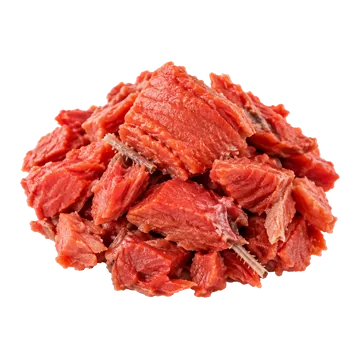 Sockeye salmon, canned
Nothing to watch: under the limit for a 55 g serving
4,900greaches the limit in a weekafter what an average adult already eats17,000 g eaten alone, from zeroEating it daily comes to 385 g a week, which stays within the 4,900 g of room left before the limit.0.57 µg per 55 g servingHealth Canada Total Diet Study, trace elements · grade B ?
How it’s rated
A daily serving adds 3.2% to an average adult's cadmium intake (EFSA 2012 adult median, 1.77 µg/kg body weight/week; Canadian adults in 2007: 1.2-1.75), far from doubling it, so no cap.
Intake: 55 g canned (HC TRA I.4), one serving a day · Level in the food: 10.33 ng/g (mean of composites, n = 13)
Measured on: Health Canada Total Diet Study, DD03 'Fish, canned (tuna and Salmon)', as consumed, 13 composites 2000-2012, no non-detects. Composite food code DD03 is canned TUNA AND SALMON together (the share of each is not stated), so this is a category figure, not a salmon measurement. Bilingual name: 12.64 ng/g, n=3, 2016-2018.
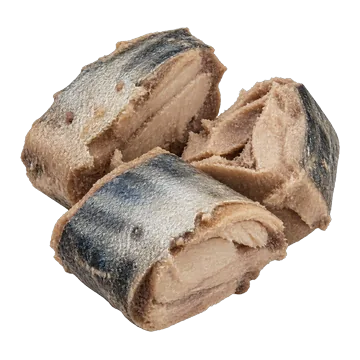 Mackerel, canned
Nothing to watch: under the limit for a 55 g serving
5,100greaches the limit in a weekafter what an average adult already eats18,000 g eaten alone, from zeroEating it daily comes to 385 g a week, which stays within the 5,100 g of room left before the limit.0.55 µg per 55 g servingCFIA mercury and metals in fish (2000–2021) · grade B ?
How it’s rated
A daily serving adds 3.1% to an average adult's cadmium intake (EFSA 2012 adult median, 1.77 µg/kg body weight/week; Canadian adults in 2007: 1.2-1.75), far from doubling it, so no cap.
Intake: one 55 g drained serving a day, 70 kg adult · Level in the food: 10 µg/kg (mean, n = 1)
Measured on: single sample: CFIA MACKEREL, ATLANTIC canned Tissue - Muscle, import, 2017-06-15
 Popcorn, air-popped
Nothing to watch: under the limit for a 50 g serving
5,100greaches the limit in a weekafter what an average adult already eats18,000 g eaten alone, from zeroEating it daily comes to 350 g a week, which stays within the 5,100 g of room left before the limit.0.5 µg per 50 g servingHealth Canada Total Diet Study, trace elements · grade A ?
How it’s rated
A daily serving adds 2.8% to an average adult's cadmium intake (EFSA 2012 adult median, 1.77 µg/kg body weight/week; Canadian adults in 2007: 1.2-1.75), far from doubling it, so no cap.
Intake: 50 g popped popcorn serving (HC TRA S.1) · Level in the food: 9.987 ng/g (mean of 15 annual TDS composites (2000-2011, 2016-2018 (15 annual composites)); 15 of 15 detected; the TDS has no air-popped line, n = 15)
Measured on: Health Canada Total Diet Study, TDS food MM01 "Popcorn, microwave", as consumed (popped, with the microwave-bag fat and salt), single-year composites; Canada. MICROWAVE popcorn used as the nearest agency analysis of popped corn; the air-popped row has no TDS code
 Avocado, raw
Nothing to watch: under the limit for a 30 g serving
5,400greaches the limit in a weekafter what an average adult already eats19,000 g eaten alone, from zeroEating it daily comes to 210 g a week, which stays within the 5,400 g of room left before the limit.0.282 µg per 30 g servingUS FDA Total Diet Study (2018–2020) · grade A ?
How it’s rated
A daily serving adds 1.6% to an average adult's cadmium intake (EFSA 2012 adult median, 1.77 µg/kg body weight/week; Canadian adults in 2007: 1.2-1.75), far from doubling it, so no cap.
Intake: one 30 g serving a day, 70 kg adult · Level in the food: 9.4 µg/kg (mean, n = 27)
Measured on: food-specific: FDA TDS FY2018-2020 #97 'Avocado, raw', 27 composites, 27 detects, standard deviation 12, min 2.1, max 59, reporting limit 1 ppb. NO Canadian TDS avocado composite exists (HC dataset searched).
 Strawberries, raw
Nothing to watch: under the limit for a 140 g serving
5,500greaches the limit in a weekafter what an average adult already eats19,000 g eaten alone, from zeroEating it daily comes to 980 g a week, which stays within the 5,500 g of room left before the limit.1.302 µg per 140 g servingUS FDA Total Diet Study (2018–2020) · grade A ?
How it’s rated
A daily serving adds 7.4% to an average adult's cadmium intake (EFSA 2012 adult median, 1.77 µg/kg body weight/week; Canadian adults in 2007: 1.2-1.75), far from doubling it, so no cap.
Intake: one 140 g serving a day, 70 kg adult · Level in the food: 9.3 µg/kg (mean, n = 27)
Measured on: FDA Total Diet Study FY2018-2020, TDS food 86 'Strawberry, raw/frozen' (fresh and frozen pooled), US, 27 samples, all detected. Health Canada's TDS has no strawberry food code (term search returned 0 records).
 Strawberries, frozen
Nothing to watch: under the limit for a 140 g serving
5,500greaches the limit in a weekafter what an average adult already eats19,000 g eaten alone, from zeroEating it daily comes to 980 g a week, which stays within the 5,500 g of room left before the limit.1.302 µg per 140 g servingUS FDA Total Diet Study (2018–2020) · grade A ?
How it’s rated
A daily serving adds 7.4% to an average adult's cadmium intake (EFSA 2012 adult median, 1.77 µg/kg body weight/week; Canadian adults in 2007: 1.2-1.75), far from doubling it, so no cap.
Intake: one 140 g serving a day, 70 kg adult · Level in the food: 9.3 µg/kg (mean, n = 27)
Measured on: FDA Total Diet Study FY2018-2020, TDS food 86 'Strawberry, raw/frozen' (fresh and frozen pooled), US, 27 samples, all detected. Health Canada's TDS has no strawberry food code (term search returned 0 records).
 Chia seeds
Nothing to watch: under the limit for a 15 g serving
More than anyone eatsNo realistic amount reaches the limit.Eating it daily comes to 105 g a week, which stays within the 5,600 g of room left before the limit.0.137 µg (at 9.1 µg/kg) per 15 g servingCFIA chemical residue monitoring (2016–2023) · grade A ?
How it’s rated
The counted figure is 5,600 g a week, about 53 servings a day.
A daily serving adds 0.77% to an average adult's cadmium intake (EFSA 2012 adult median, 1.77 µg/kg body weight/week; Canadian adults in 2007: 1.2-1.75), far from doubling it, so no cap.
Intake: 15 g serving (HC TRA C.5) · Level in the food: 9.1 µg/kg (highest annual mean of positives (range of annual means 0.0047-0.0091 ppm, i.e. 4.7-9.1 µg/kg); 27 of 38 samples positive; max 20.2 µg/kg, n = 38)
Measured on: CFIA NCRMP annex B6 (imports) 2017-18 to 2020-21, commodity 'Seed - Chia', 38 samples, 27 positive, 0 violations; Canada (imports); the annex states no detection limit (detection limit)
 Chia seeds, ground
Nothing to watch: under the limit for a 15 g serving
More than anyone eatsNo realistic amount reaches the limit.Eating it daily comes to 105 g a week, which stays within the 5,600 g of room left before the limit.0.137 µg (at 9.1 µg/kg) per 15 g servingCFIA chemical residue monitoring (2016–2023) · grade A ?
How it’s rated
The counted figure is 5,600 g a week, about 53 servings a day.
A daily serving adds 0.77% to an average adult's cadmium intake (EFSA 2012 adult median, 1.77 µg/kg body weight/week; Canadian adults in 2007: 1.2-1.75), far from doubling it, so no cap.
Intake: 15 g serving (HC TRA C.5) · Level in the food: 9.1 µg/kg (highest annual mean of positives (range of annual means 0.0047-0.0091 ppm, i.e. 4.7-9.1 µg/kg); 27 of 38 samples positive; max 20.2 µg/kg, n = 38)
Measured on: CFIA NCRMP annex B6 (imports) 2017-18 to 2020-21, commodity 'Seed - Chia', 38 samples, 27 positive, 0 violations; Canada (imports); the annex states no detection limit (detection limit)
- Albacore (white) tuna, canned in water
Nothing to watch: under the limit for a 55 g serving
5,700greaches the limit in a weekafter what an average adult already eats20,000 g eaten alone, from zeroEating it daily comes to 385 g a week, which stays within the 5,700 g of room left before the limit.0.49 µg per 55 g servingCFIA mercury and metals in fish (2000–2021) · grade A ?
How it’s rated
A daily serving adds 2.8% to an average adult's cadmium intake (EFSA 2012 adult median, 1.77 µg/kg body weight/week; Canadian adults in 2007: 1.2-1.75), far from doubling it, so no cap.
Intake: one 55 g serving a day, 70 kg adult · Level in the food: 8.9 µg/kg (mean, n = 17)
Measured on: food-specific: CFIA canned albacore 2003-2021 (resolution 0.01 ppm; max 20 µg/kg)
 Brussels sprouts, cooked
Nothing to watch: under the limit for a 85 g serving
5,900greaches the limit in a weekafter what an average adult already eats20,000 g eaten alone, from zeroEating it daily comes to 595 g a week, which stays within the 5,900 g of room left before the limit.0.74 µg per 85 g servingHealth Canada Total Diet Study, trace elements · grade A ?
How it’s rated
A daily serving adds 4.2% to an average adult's cadmium intake (EFSA 2012 adult median, 1.77 µg/kg body weight/week; Canadian adults in 2007: 1.2-1.75), far from doubling it, so no cap.
Intake: one 85 g serving a day, 70 kg adult · Level in the food: 8.73 µg/kg (mean, n = 11)
Measured on: food-specific: Health Canada TDS GG24 'Brussel sprouts', 11 composites 2005-2018 (Toronto, Halifax, Vancouver, Quebec City, Calgary, St. John's, Ottawa), 'As consumed'; raw vs cooked not stated in the dataset
 Brown rice, cooked
Nothing to watch: under the limit for a 140 g serving
6,400greaches the limit in a weekafter what an average adult already eats22,000 g eaten alone, from zeroEating it daily comes to 980 g a week, which stays within the 6,400 g of room left before the limit.1.12 µg per 140 g servingUS FDA Total Diet Study (2018–2020) · grade A ?
How it’s rated
A daily serving adds 6.3% to an average adult's cadmium intake (EFSA 2012 adult median, 1.77 µg/kg body weight/week; Canadian adults in 2007: 1.2-1.75), far from doubling it, so no cap.
Intake: one 140 g cooked serving a day (HC TRA C.7), 70 kg adult · Level in the food: 8 ppb (mean (27 composites, all detected; standard deviation 4.3, min 2.2, max 17), n = 27)
Measured on: food-specific: US FDA Total Diet Study FY2018-2020 elements supplement, TDS food 402 'Rice, brown, cooked' (as eaten, US), 27 samples, reporting limit stated per analyte; Health Canada TDS has no brown-rice code (its FF19 is the white-rice composite), so FDA is the only source that matches the preparation
 Raspberries, raw
Nothing to watch: under the limit for a 80 g serving
6,500greaches the limit in a weekafter what an average adult already eats22,000 g eaten alone, from zeroEating it daily comes to 560 g a week, which stays within the 6,500 g of room left before the limit.0.633 µg per 80 g servingCFIA chemical residue monitoring (2016–2023) · grade A ?
How it’s rated
A daily serving adds 3.6% to an average adult's cadmium intake (EFSA 2012 adult median, 1.77 µg/kg body weight/week; Canadian adults in 2007: 1.2-1.75), far from doubling it, so no cap.
Intake: one 80 g serving a day, 70 kg adult · Level in the food: 7.91 µg/kg (mean, n = 85)
Measured on: CFIA NCRMP 2016-17 to 2022-23, commodity 'Raspberry', domestic B1 (n 15) and import B2 (n 70) pooled by sample count (n 85); non-detects as 0. Health Canada's TDS has no raspberry code and FDA's TDS has no raspberry food. Cadmium: B1 8 positives, lower-bound mean 8.39 µg/kg; B2 42 positives, 7.81 µg/kg.
 Raspberries, frozen
Nothing to watch: under the limit for a 80 g serving
6,500greaches the limit in a weekafter what an average adult already eats22,000 g eaten alone, from zeroEating it daily comes to 560 g a week, which stays within the 6,500 g of room left before the limit.0.633 µg per 80 g servingCFIA chemical residue monitoring (2016–2023) · grade A ?
How it’s rated
A daily serving adds 3.6% to an average adult's cadmium intake (EFSA 2012 adult median, 1.77 µg/kg body weight/week; Canadian adults in 2007: 1.2-1.75), far from doubling it, so no cap.
Intake: one 80 g serving a day, 70 kg adult · Level in the food: 7.91 µg/kg (mean, n = 85)
Measured on: CFIA NCRMP 2016-17 to 2022-23, commodity 'Raspberry', domestic B1 (n 15) and import B2 (n 70) pooled by sample count (n 85); non-detects as 0. Health Canada's TDS has no raspberry code and FDA's TDS has no raspberry food. Cadmium: B1 8 positives, lower-bound mean 8.39 µg/kg; B2 42 positives, 7.81 µg/kg.
 Zucchini, cooked
Nothing to watch: under the limit for a 85 g serving
7,200greaches the limit in a weekafter what an average adult already eats25,000 g eaten alone, from zeroEating it daily comes to 595 g a week, which stays within the 7,200 g of room left before the limit.0.603 µg per 85 g servingUS FDA Total Diet Study (2018–2020) · grade A ?
How it’s rated
A daily serving adds 3.4% to an average adult's cadmium intake (EFSA 2012 adult median, 1.77 µg/kg body weight/week; Canadian adults in 2007: 1.2-1.75), far from doubling it, so no cap.
Intake: one serving a day, 70 kg adult · Level in the food: 7.1 µg/kg (mean, n = 27)
Measured on: FDA Total Diet Study FY2018-2020, TDS food 407 'Zucchini, fresh/frozen, boiled' (US), 27 samples, 24 detects, reporting limit 1 ppb, standard deviation 16, max 84 ppb.
 Pumpkin seeds
Nothing to watch: under the limit for a 30 g serving
7,300greaches the limit in a weekafter what an average adult already eats25,000 g eaten alone, from zeroEating it daily comes to 210 g a week, which stays within the 7,300 g of room left before the limit.0.21 µg per 30 g servingPmcid:pmc1017 8162 · grade A ?
How it’s rated
A daily serving adds 1.2% to an average adult's cadmium intake (EFSA 2012 adult median, 1.77 µg/kg body weight/week; Canadian adults in 2007: 1.2-1.75), far from doubling it, so no cap.
Intake: one 30 g serving a day, 70 kg adult · Level in the food: 7 µg/kg (mean, n = 11)
Measured on: food-specific: pumpkin seeds, Swedish retail 2018, Swedish Food Agency ICP-MS (as sold, mostly shelled). No Health Canada or FDA TDS pumpkin item
 Cantaloupe, raw
Nothing to watch: under the limit for a 150 g serving
7,500greaches the limit in a weekafter what an average adult already eats26,000 g eaten alone, from zeroEating it daily comes to 1,050 g a week, which stays within the 7,500 g of room left before the limit.1.02 µg per 150 g servingHealth Canada Total Diet Study, trace elements · grade B ?
How it’s rated
A daily serving adds 5.8% to an average adult's cadmium intake (EFSA 2012 adult median, 1.77 µg/kg body weight/week; Canadian adults in 2007: 1.2-1.75), far from doubling it, so no cap.
Intake: one serving a day, 70 kg adult · Level in the food: 6.8 ng/g (mean (equal-weight of composites; 2000-2012 and 2016-2018 sets pooled by n), n = 16)
Measured on: Health Canada Total Diet Study trace elements, TDS food HH12 'Melons (cantaloupe and watermelon)': 13 composites 2000-2012 (6.923 ng/g) and 3 composites 2016-2018 (6.262 ng/g), as consumed, no non-detects.
 White rice, cooked
Nothing to watch: under the limit for a 140 g serving
7,700greaches the limit in a weekafter what an average adult already eats26,000 g eaten alone, from zeroEating it daily comes to 980 g a week, which stays within the 7,700 g of room left before the limit.0.93 µg per 140 g servingHealth Canada Total Diet Study, trace elements · grade A ?
How it’s rated
A daily serving adds 5.3% to an average adult's cadmium intake (EFSA 2012 adult median, 1.77 µg/kg body weight/week; Canadian adults in 2007: 1.2-1.75), far from doubling it, so no cap.
Intake: one serving a day, 70 kg adult · Level in the food: 6.64 µg/kg (mean, n = 16)
Measured on: food-specific: HC TDS FF19 'White Rice (Long, Med, Short Grain)', 16 composites 2000-2018, ready-to-eat, as consumed
 Bok choy, raw
Nothing to watch: under the limit for a 85 g serving
7,900greaches the limit in a weekafter what an average adult already eats27,000 g eaten alone, from zeroEating it daily comes to 595 g a week, which stays within the 7,900 g of room left before the limit.0.55 µg per 85 g servingHow it’s rated
A daily serving adds 3.1% to an average adult's cadmium intake (EFSA 2012 adult median, 1.77 µg/kg body weight/week; Canadian adults in 2007: 1.2-1.75), far from doubling it, so no cap.
Intake: one 85 g serving a day, 70 kg adult · Level in the food: 6.43 µg/kg (mean, n = 1952)
Measured on: category: Brassica vegetables (EFSA 2012; FoodEx1 files Chinese cabbage here)
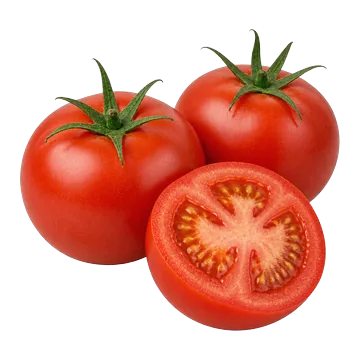 Tomatoes, raw
Nothing to watch: under the limit for a 85 g serving
8,000greaches the limit in a weekafter what an average adult already eats27,000 g eaten alone, from zeroEating it daily comes to 595 g a week, which stays within the 8,000 g of room left before the limit.0.544 µg per 85 g servingHealth Canada Total Diet Study, trace elements · grade A ?
How it’s rated
A daily serving adds 3.1% to an average adult's cadmium intake (EFSA 2012 adult median, 1.77 µg/kg body weight/week; Canadian adults in 2007: 1.2-1.75), far from doubling it, so no cap.
Intake: one 85 g serving a day (Health Canada V.1), 70 kg adult · Level in the food: 6.4 µg/kg (mean (equal-weight), n = 16)
Measured on: category: HC TDS GG20 "Tomatoes (Cooked and raw tomatoes)", 16 composites 2000-2018, one per year per city (a raw + cooked pool, tomato only)
- Pies
Nothing to watch: under the limit for a 110 g serving
8,300greaches the limit in a weekafter what an average adult already eats28,000 g eaten alone, from zeroEating it daily comes to 770 g a week, which stays within the 8,300 g of room left before the limit.0.68 µg per 110 g servingHealth Canada Total Diet Study, trace elements · grade A ?
How it’s rated
A daily serving adds 3.8% to an average adult's cadmium intake (EFSA 2012 adult median, 1.77 µg/kg body weight/week; Canadian adults in 2007: 1.2-1.75), far from doubling it, so no cap.
Intake: one 110 g reference serving a day (Health Canada TRA A.22), 70 kg adult · Level in the food: 6.184 ng/g (mean, n = 16)
Measured on: food-specific: Health Canada Total Diet Study FF17 'Pie, apple', 16 composites, 2000-2012 and 2016-2018, Canada, as consumed
 Shrimp, cooked
Nothing to watch: under the limit for a 100 g serving
8,800greaches the limit in a weekafter what an average adult already eats30,000 g eaten alone, from zeroEating it daily comes to 700 g a week, which stays within the 8,800 g of room left before the limit.0.58 µg per 100 g servingHealth Canada Total Diet Study, trace elements · grade A ?
How it’s rated
A daily serving adds 3.3% to an average adult's cadmium intake (EFSA 2012 adult median, 1.77 µg/kg body weight/week; Canadian adults in 2007: 1.2-1.75), far from doubling it, so no cap.
Intake: 100 g cooked (HC TRA I.3), one serving a day · Level in the food: 5.778 ng/g (mean of composites, n = 13)
Measured on: Health Canada Total Diet Study, TDS food code DD04 'Shellfish (cooked shrimp)', as consumed, 13 composites 2000-2012; no non-detects. A second set under the bilingual name: 1.271 ng/g, n=3, 2016-2018.
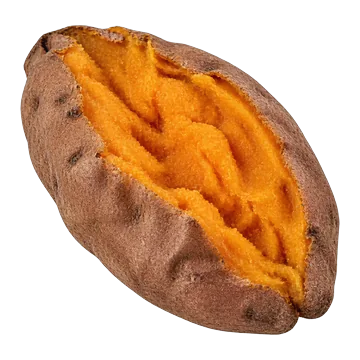 Sweet potato, baked
Nothing to watch: under the limit for a 110 g serving
9,000greaches the limit in a weekafter what an average adult already eats31,000 g eaten alone, from zeroEating it daily comes to 770 g a week, which stays within the 9,000 g of room left before the limit.0.63 µg per 110 g servingUS FDA Total Diet Study (2018–2020) · grade A ?
How it’s rated
A daily serving adds 3.5% to an average adult's cadmium intake (EFSA 2012 adult median, 1.77 µg/kg body weight/week; Canadian adults in 2007: 1.2-1.75), far from doubling it, so no cap.
Intake: one 110 g serving a day, 70 kg adult · Level in the food: 5.7 µg/kg (mean, n = 27)
Measured on: food-specific: FDA TDS #397 'Sweet potato, baked, peel removed', FY2018-2020, 27 samples, 27 detects, range 2.2-12 ppb
 Sweet potato, boiled
Nothing to watch: under the limit for a 110 g serving
9,000greaches the limit in a weekafter what an average adult already eats31,000 g eaten alone, from zeroEating it daily comes to 770 g a week, which stays within the 9,000 g of room left before the limit.0.63 µg per 110 g servingUS FDA Total Diet Study (2018–2020) · grade B ?
How it’s rated
A daily serving adds 3.5% to an average adult's cadmium intake (EFSA 2012 adult median, 1.77 µg/kg body weight/week; Canadian adults in 2007: 1.2-1.75), far from doubling it, so no cap.
Intake: one 110 g serving a day, 70 kg adult · Level in the food: 5.7 µg/kg (mean, n = 27)
Measured on: related preparation: FDA TDS #397 baked, peel removed (no boiled sweet potato in the TDS)
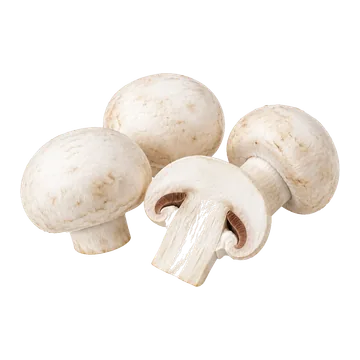 Mushrooms, raw
Nothing to watch: under the limit for a 85 g serving
9,100greaches the limit in a weekafter what an average adult already eats31,000 g eaten alone, from zeroEating it daily comes to 595 g a week, which stays within the 9,100 g of room left before the limit.0.475 µg per 85 g servingHealth Canada Total Diet Study, trace elements · grade A ?
How it’s rated
A daily serving adds 2.7% to an average adult's cadmium intake (EFSA 2012 adult median, 1.77 µg/kg body weight/week; Canadian adults in 2007: 1.2-1.75), far from doubling it, so no cap.
Intake: one 85 g serving a day, 70 kg adult · Level in the food: 5.593 µg/kg (mean (equal-weight of composites; two sets pooled by n), n = 16)
Measured on: Health Canada TDS GG12 'Mushrooms (Cooked and raw mushrooms)', as consumed, Canada; 2000-2012 n 13 and 2016-2018 n 3 pooled by n (n 16); non-detects stored as 0, none here. Covers raw and cooked together.
 Black beans, canned
Nothing to watch: under the limit
9,300greaches the limit in a weekafter what an average adult already eats32,000 g eaten alone, from zeroEating it daily comes to 910 g a week, which stays within the 9,300 g of room left before the limit.US FDA Total Diet Study (2018–2020) · grade A ?
How it’s rated
A daily serving adds 4% to an average adult's cadmium intake (EFSA 2012 adult median, 1.77 µg/kg body weight/week; Canadian adults in 2007: 1.2-1.75), far from doubling it, so no cap.
Intake: one 130 g serving a day (FDC RACC weight, illustrative: no Health Canada weight for 125 mL of drained black beans), 70 kg adult · Level in the food: 5.5 µg/kg (mean, n = 3)
Measured on: food-specific: FDA TDS #527 "Beans, black, canned, drained solids" (n = 3, standard deviation 7.4, min 1.1, max 14, RL 1 µg/kg)
 Mackerel, cooked
Nothing to watch: under the limit for a 100 g serving
9,700greaches the limit in a weekafter what an average adult already eats33,000 g eaten alone, from zeroEating it daily comes to 700 g a week, which stays within the 9,700 g of room left before the limit.0.526 µg (raw concentration x1.282 for cooking loss) per 100 g servingCFIA mercury and metals in fish (2000–2021) · grade A ?
How it’s rated
A daily serving adds 2.3% to an average adult's cadmium intake (EFSA 2012 adult median, 1.77 µg/kg body weight/week; Canadian adults in 2007: 1.2-1.75), far from doubling it, so no cap.
Intake: one 100 g cooked serving a day, 70 kg adult; concentration = raw x1.282 (Foodtopsy's arithmetic) · Level in the food: 4.1 µg/kg (mean, n = 7)
Measured on: food-specific: CFIA MACKEREL, ATLANTIC edible portion, 7 samples 2004-2020 (3 non-detects stored as 0)
 Pistachios, dry-roasted
Nothing to watch: under the limit for a 30 g serving
More than anyone eatsNo realistic amount reaches the limit.Eating it daily comes to 210 g a week, which stays within the 11,000 g of room left before the limit.0.134 µg per 30 g servingBielecka 2021 · grade B ?
How it’s rated
The counted figure is 11,000 g a week, about 54 servings a day.
A daily serving adds 0.76% to an average adult's cadmium intake (EFSA 2012 adult median, 1.77 µg/kg body weight/week; Canadian adults in 2007: 1.2-1.75), far from doubling it, so no cap.
Intake: 30 g shelled serving (HC TRA O.1) · Level in the food: 4.48 µg/kg (mean ± standard deviation 4.48 ± 3.88 (range 0.62-13.27; median 2.72, Q1-Q3 2.09-5.62), n = 10)
Measured on: Polish retail survey (Bielecka 2021), pistachios, 10 samples (one per producer), GFAAS, Cd detection limit (detection limit) 0.02 µg/kg; weight basis not stated; Poland. No Health Canada TDS code and no FDA TDS line for pistachios
 Dried cranberries, sweetened
Nothing to watch: under the limit for a 40 g serving
12,000greaches the limit in a weekafter what an average adult already eats41,000 g eaten alone, from zeroEating it daily comes to 280 g a week, which stays within the 12,000 g of room left before the limit.0.17 µg per 40 g servingPubMed 34099845 · grade C ?
How it’s rated
A daily serving adds 0.96% to an average adult's cadmium intake (EFSA 2012 adult median, 1.77 µg/kg body weight/week; Canadian adults in 2007: 1.2-1.75), far from doubling it, so no cap.
Intake: one 40 g serving a day, 70 kg adult · Level in the food: 0.004 mg/kg (mean (reported on dry weight; converted to as-eaten), n = 5)
Measured on: Rusin et al. 2021 (Sci Rep), Polish retail fruit and vegetable survey, graphite-furnace/flame AAS: dried cranberry, 5 samples (Table 1), Cd mean 0.005 mg/kg DRY WEIGHT, standard deviation 0.0039, range 0.0016-0.010 (Table 6; blank cells are values below the quantification limit (quantification limit), so the mean may cover only the quantified samples). Converted to the as-eaten product with the water content of the sweetened dried-cranberry row itself (Foundation 2758976, 14.87 g water/100 g): 0.005 x (1 - 0.1487) = 0.00426 mg/kg. Whether the 5 were sweetened or unsweetened is not stated; Polish retail, not Canadian. CFIA fresh-fruit figures (n 28, lower bound mean 0.0049 ppm) stay in notes as the fresh-fruit context.
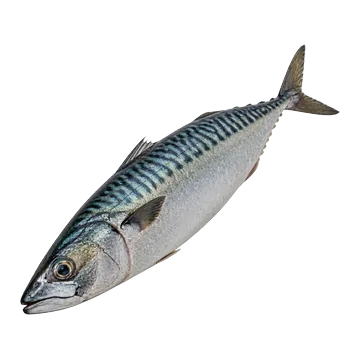 Mackerel, raw
Nothing to watch: under the limit for a 125 g serving
12,000greaches the limit in a weekafter what an average adult already eats43,000 g eaten alone, from zeroEating it daily comes to 875 g a week, which stays within the 12,000 g of room left before the limit.0.512 µg per 125 g servingCFIA mercury and metals in fish (2000–2021) · grade A ?
How it’s rated
A daily serving adds 2.9% to an average adult's cadmium intake (EFSA 2012 adult median, 1.77 µg/kg body weight/week; Canadian adults in 2007: 1.2-1.75), far from doubling it, so no cap.
Intake: one 125 g raw serving a day, 70 kg adult · Level in the food: 4.1 µg/kg (mean, n = 7)
Measured on: food-specific: CFIA MACKEREL, ATLANTIC edible portion, 7 samples 2004-2020 (3 non-detects stored as 0)
 Sauerkraut
Nothing to watch: under the limit for a 30 g serving
More than anyone eatsNo realistic amount reaches the limit.Eating it daily comes to 210 g a week, which stays within the 13,000 g of room left before the limit.0.119 µg per 30 g servingHealth Canada Total Diet Study, trace elements · grade B ?
How it’s rated
The counted figure is 13,000 g a week, about 61 servings a day.
A daily serving adds 0.67% to an average adult's cadmium intake (EFSA 2012 adult median, 1.77 µg/kg body weight/week; Canadian adults in 2007: 1.2-1.75), far from doubling it, so no cap.
Intake: one 30 g serving a day, 70 kg adult · Level in the food: 3.972 µg/kg (mean, n = 16)
Measured on: RELATED FOOD (grade B): Health Canada TDS GG05 'Cabbage (cooked and raw)', 16 composites 2000-2018 (as consumed). No sauerkraut composite exists in the Canadian TDS or the FDA TDS FY18-20. Beside it EFSA 2012 'Brassica vegetables' MB 6.43 µg/kg (lower bound 5.39, upper bound 7.47; n = 1,952) and FDA TDS FY18-20 #406 'Cabbage, raw' 5.5 ppb (27 of 27 detected, standard deviation 2.5)
 Green cabbage, cooked
Nothing to watch: under the limit for a 85 g serving
13,000greaches the limit in a weekafter what an average adult already eats44,000 g eaten alone, from zeroEating it daily comes to 595 g a week, which stays within the 13,000 g of room left before the limit.0.34 µg per 85 g servingHealth Canada Total Diet Study, trace elements · grade A ?
How it’s rated
A daily serving adds 1.9% to an average adult's cadmium intake (EFSA 2012 adult median, 1.77 µg/kg body weight/week; Canadian adults in 2007: 1.2-1.75), far from doubling it, so no cap.
Intake: one 85 g serving a day, 70 kg adult · Level in the food: 3.97 µg/kg (mean, n = 16)
Measured on: food-specific: Health Canada TDS GG05 'Cabbage (cooked and raw cabbage)', green cabbage, 16 composites 2000-2018 (the TDS composite mixes cooked and raw, so it fits the raw and the cooked listing alike)
 Deli turkey breast
Nothing to watch: under the limit for a 55 g serving
13,000greaches the limit in a weekafter what an average adult already eats45,000 g eaten alone, from zeroEating it daily comes to 385 g a week, which stays within the 13,000 g of room left before the limit.0.214 µg per 55 g servingUS FDA Total Diet Study (2018–2020) · grade A ?
How it’s rated
A daily serving adds 1.2% to an average adult's cadmium intake (EFSA 2012 adult median, 1.77 µg/kg body weight/week; Canadian adults in 2007: 1.2-1.75), far from doubling it, so no cap.
Intake: one 55 g reference serving a day, 70 kg adult · Level in the food: 3.9 µg/kg (mean of 3 composites (FDA; ppb = µg/kg), n = 3)
Measured on: US FDA Total Diet Study FY2018-2020, TDS food 543 'Luncheon meat, turkey', n 3 composites, as prepared; non-detects counted as zero (inferred, see notes); 3 of 3 detected, max 6 ppb, standard deviation 1.9, RL 1 ppb
 Oatmeal, cooked with water
Nothing to watch: under the limit for a 247 g serving
14,000greaches the limit in a weekafter what an average adult already eats47,000 g eaten alone, from zeroEating it daily comes to 1,731 g a week, which stays within the 14,000 g of room left before the limit.0.92 µg per 247 g servingHealth Canada Total Diet Study, trace elements · grade A ?
How it’s rated
A daily serving adds 5.2% to an average adult's cadmium intake (EFSA 2012 adult median, 1.77 µg/kg body weight/week; Canadian adults in 2007: 1.2-1.75), far from doubling it, so no cap.
Intake: one 250 mL (247.3 g) cooked serving a day, 70 kg adult · Level in the food: 3.712 µg/kg (mean, n = 16)
Measured on: food-specific: Health Canada TDS FF07 'Cereals, oatmeal (Quick cook oatmeal)', as consumed, 16 single-city composites 2000-2018 (equal weight)
 Soy sauce
Nothing to watch: under the limit for a 16 g serving
More than anyone eatsNo realistic amount reaches the limit.Eating it daily comes to 112 g a week, which stays within the 14,000 g of room left before the limit.0.057 µg (per tablespoon, 16 g) per 16 g servingHealth Canada Total Diet Study, trace elements · grade A ?
How it’s rated
The counted figure is 14,000 g a week, about 128 servings a day.
A daily serving adds 0.32% to an average adult's cadmium intake (EFSA 2012 adult median, 1.77 µg/kg body weight/week; Canadian adults in 2007: 1.2-1.75), far from doubling it, so no cap.
Intake: one tablespoon (15 mL, 16 g) a day, 70 kg adult · Level in the food: 3.554 ng/g (mean (equal-weight, 16 annual composites), n = 16)
Measured on: Health Canada TDS trace elements, TDS food PP07 'Soya sauce', 16 single-year composites 2000-2018 (2000-2012, 2016, 2017, 2018), as consumed; ng/g; mean of the equal-weight annual composites, recomputed from the per-year values; non-detects at half the detection limit (detection limit) (none in this analyte); no pooled 1993-99 composite exists for this code.
 White beans, cooked
Nothing to watch: under the limit for a 95 g serving
14,000greaches the limit in a weekafter what an average adult already eats49,000 g eaten alone, from zeroEating it daily comes to 662 g a week, which stays within the 14,000 g of room left before the limit.0.33 µg per 95 g servingHealth Canada Total Diet Study, trace elements · grade B ?
How it’s rated
A daily serving adds 1.9% to an average adult's cadmium intake (EFSA 2012 adult median, 1.77 µg/kg body weight/week; Canadian adults in 2007: 1.2-1.75), far from doubling it, so no cap.
Intake: one 95 g serving a day, 70 kg adult · Level in the food: 3.54 µg/kg (mean, n = 15)
Measured on: related product: Health Canada TDS GG01 "Baked beans, canned" (beans in sauce, bean class not stated), 15 composites 2000-2018, equal-weight mean; recent 2012-2018 (n = 4) mean 3.50
 Pinto beans, cooked
Nothing to watch: under the limit for a 90 g serving
14,000greaches the limit in a weekafter what an average adult already eats49,000 g eaten alone, from zeroEating it daily comes to 632 g a week, which stays within the 14,000 g of room left before the limit.0.32 µg per 90 g servingHealth Canada Total Diet Study, trace elements · grade B ?
How it’s rated
A daily serving adds 1.8% to an average adult's cadmium intake (EFSA 2012 adult median, 1.77 µg/kg body weight/week; Canadian adults in 2007: 1.2-1.75), far from doubling it, so no cap.
Intake: one 90 g serving a day, 70 kg adult · Level in the food: 3.54 µg/kg (mean, n = 15)
Measured on: related product: Health Canada TDS GG01 "Baked beans, canned" (beans in sauce, bean class not stated), 15 composites 2000-2018, equal-weight mean; recent 2012-2018 (n = 4) mean 3.50
 Black beans, cooked
Nothing to watch: under the limit for a 91 g serving
14,000greaches the limit in a weekafter what an average adult already eats49,000 g eaten alone, from zeroEating it daily comes to 636 g a week, which stays within the 14,000 g of room left before the limit.0.32 µg per 91 g servingHealth Canada Total Diet Study, trace elements · grade B ?
How it’s rated
A daily serving adds 1.8% to an average adult's cadmium intake (EFSA 2012 adult median, 1.77 µg/kg body weight/week; Canadian adults in 2007: 1.2-1.75), far from doubling it, so no cap.
Intake: one 91 g serving a day, 70 kg adult · Level in the food: 3.54 µg/kg (mean, n = 15)
Measured on: related product: Health Canada TDS GG01 "Baked beans, canned" (beans in sauce, bean class not stated), 15 composites 2000-2018, equal-weight mean; recent 2012-2018 (n = 4) mean 3.50
 Kidney beans, cooked
Nothing to watch: under the limit
14,000greaches the limit in a weekafter what an average adult already eats49,000 g eaten alone, from zeroHealth Canada Total Diet Study, trace elements · grade B ?
How it’s rated
A daily serving adds 2% to an average adult's cadmium intake (EFSA 2012 adult median, 1.77 µg/kg body weight/week; Canadian adults in 2007: 1.2-1.75), far from doubling it, so no cap.
Intake: 100 g cooked beans (illustration) · Level in the food: 3.54 ng/g (mean of 15 composites, related product (non-detects as 0), n = 15)
Measured on: related product, NOT boiled kidney beans: Health Canada TDS GG01 'Baked beans, canned' (beans in sauce, class not stated), as consumed, 2000-2018 (12 composites 2000-2012 mean 3.586 and 3 composites 2016-2018 mean 3.332); the same row that the black, pinto and white bean rows carry
 Refried beans, canned
Nothing to watch: under the limit for a 90 g serving
14,000greaches the limit in a weekafter what an average adult already eats49,000 g eaten alone, from zeroEating it daily comes to 632 g a week, which stays within the 14,000 g of room left before the limit.0.32 µg per 90 g servingHealth Canada Total Diet Study, trace elements · grade B ?
How it’s rated
A daily serving adds 1.8% to an average adult's cadmium intake (EFSA 2012 adult median, 1.77 µg/kg body weight/week; Canadian adults in 2007: 1.2-1.75), far from doubling it, so no cap.
Intake: one 90 g serving a day, 70 kg adult · Level in the food: 3.54 µg/kg (mean, n = 15)
Measured on: related product: Health Canada TDS GG01 "Baked beans, canned" (beans in sauce, bean class not stated), 15 composites 2000-2018, equal-weight mean; recent 2012-2018 (n = 4) mean 3.50
 Tortilla chips
Nothing to watch: under the limit for a 50 g serving
16,000greaches the limit in a weekafter what an average adult already eats54,000 g eaten alone, from zeroEating it daily comes to 350 g a week, which stays within the 16,000 g of room left before the limit.0.161 µg per 50 g servingHealth Canada Total Diet Study, trace elements · grade A ?
How it’s rated
A daily serving adds 0.91% to an average adult's cadmium intake (EFSA 2012 adult median, 1.77 µg/kg body weight/week; Canadian adults in 2007: 1.2-1.75), far from doubling it, so no cap.
Intake: one 50 g reference serving a day (Health Canada TRA S.1), 70 kg adult · Level in the food: 3.215 ng/g (mean, n = 9)
Measured on: food-specific: Health Canada Total Diet Study 'Snack Food, Corn Chips' (TDS code GG27 Corn chips), 9 composites, 2007-2018, Canada, as consumed
1 other measurement of this food
- US FDA TDS 2018-20, tortilla chips
Nothing to watch: under the limit
More than anyone eatsNo realistic amount reaches the limit.Eating it daily comes to 350 g a week, which stays within the 26,000 g of room left before the limit.0.1 µg per 50 g servingUS FDA Total Diet Study (2018–2020) · grade A ?
How it’s rated
The counted figure is 26,000 g a week, about 73 servings a day.
A daily serving adds 0.56% to an average adult's cadmium intake (EFSA 2012 adult median, 1.77 µg/kg body weight/week; Canadian adults in 2007: 1.2-1.75), far from doubling it, so no cap.
Intake: one 50 g reference serving a day (Health Canada TRA S.1), 70 kg adult · Level in the food: 2 ppb (mean, n = 3)
Measured on: food-specific: FDA Total Diet Study FY2018-2020, TDS food #67 'Chips, tortilla', 3 composites, US
 Ham, sliced
Nothing to watch: under the limit for a 55 g serving
16,000greaches the limit in a weekafter what an average adult already eats56,000 g eaten alone, from zeroEating it daily comes to 385 g a week, which stays within the 16,000 g of room left before the limit.0.171 µg per 55 g servingHealth Canada Total Diet Study, trace elements · grade A ?
How it’s rated
A daily serving adds 0.97% to an average adult's cadmium intake (EFSA 2012 adult median, 1.77 µg/kg body weight/week; Canadian adults in 2007: 1.2-1.75), far from doubling it, so no cap.
Intake: one 55 g reference serving a day, 70 kg adult · Level in the food: 3.112 µg/kg (mean (equal-weight of composites; two label eras pooled by n), n = 16)
Measured on: Health Canada Total Diet Study trace elements, TDS food BB05 'Pork, cured (ham and bacon)', as consumed, Canada; 2000-2012 n 13 (mean 3.401) + 2016-2018 n 3 (mean 1.861) pooled by n (n 16); non-detects stored as 0, none occurred; the code covers ham and bacon together
 Pork sausage, pan-fried
Nothing to watch: under the limit for a 55 g serving
17,000greaches the limit in a weekafter what an average adult already eats57,000 g eaten alone, from zeroEating it daily comes to 385 g a week, which stays within the 17,000 g of room left before the limit.0.17 µg per 55 g servingHealth Canada Total Diet Study, trace elements · grade A ?
How it’s rated
A daily serving adds 0.96% to an average adult's cadmium intake (EFSA 2012 adult median, 1.77 µg/kg body weight/week; Canadian adults in 2007: 1.2-1.75), far from doubling it, so no cap.
Intake: one 55 g cooked serving a day, 70 kg adult (Health Canada TRA L.5) · Level in the food: 3.097 ng/g (µg/kg) (mean (equal-weight over composites, both label eras pooled n-weighted), n = 16)
Measured on: Health Canada TDS BB11 "Wieners & sausages (wieners, and fresh sausage)", As consumed, Canada, 16 composites: 13 in 2000-2012 (mean 3.317) and 3 in 2016-2018 (mean 2.143); no non-detects; non-detects stored as 0 in the dataset (so lower bound); detection limit (detection limit) range 0-0; the TDS item pools wieners (frankfurters) with fresh sausage
 Soy drink, unsweetened, fortified
Nothing to watch: under the limit for a 250 g serving
17,000greaches the limit in a weekafter what an average adult already eats57,000 g eaten alone, from zeroEating it daily comes to 1,750 g a week, which stays within the 17,000 g of room left before the limit.0.763 µg per 250 g servingHealth Canada Total Diet Study, trace elements · grade A ?
How it’s rated
A daily serving adds 4.3% to an average adult's cadmium intake (EFSA 2012 adult median, 1.77 µg/kg body weight/week; Canadian adults in 2007: 1.2-1.75), far from doubling it, so no cap.
Intake: one 250 mL serving (250 g) a day, 70 kg adult · Level in the food: 3.052 ng/g (mean (equal-weight of single-year composites), n = 10)
Measured on: Health Canada Total Diet Study, trace elements, TDS code KK07 'Soy beverage, fortified', as consumed, composites from 2006-2012 and 2016-2018 (10 single-year composites; no 1993-99 pooled composite is in this row); equal-weight mean of the composites; non-detects stored as 0 (0 non-detects for this analyte)
 Sweet corn, frozen, cooked
Nothing to watch: under the limit for a 85 g serving
20,000greaches the limit in a weekafter what an average adult already eats70,000 g eaten alone, from zeroEating it daily comes to 595 g a week, which stays within the 20,000 g of room left before the limit.0.212 µg per 85 g servingUS FDA Total Diet Study (2018–2020) · grade A ?
How it’s rated
A daily serving adds 1.2% to an average adult's cadmium intake (EFSA 2012 adult median, 1.77 µg/kg body weight/week; Canadian adults in 2007: 1.2-1.75), far from doubling it, so no cap.
Intake: one 85 g serving a day, 70 kg adult · Level in the food: 2.5 ppb (mean, n = 27)
Measured on: FDA Total Diet Study FY2018-2020, TDS food 54 'Corn, frozen, boiled', US, 27 samples, 26 detected, max 4.8 ppb; non-detects counted as zero by the FDA summary (lower bound). The exact preparation; Health Canada's TDS has no frozen-corn code (GG09 is 'Corn, cooked fresh, canned and creamed').
 Mango, raw
Nothing to watch: under the limit for a 140 g serving
20,000greaches the limit in a weekafter what an average adult already eats70,000 g eaten alone, from zeroEating it daily comes to 980 g a week, which stays within the 20,000 g of room left before the limit.0.35 µg per 140 g servingUS FDA Total Diet Study (2018–2020) · grade B ?
How it’s rated
A daily serving adds 2% to an average adult's cadmium intake (EFSA 2012 adult median, 1.77 µg/kg body weight/week; Canadian adults in 2007: 1.2-1.75), far from doubling it, so no cap.
Intake: one 140 g serving a day, 70 kg adult · Level in the food: 2.5 µg/kg (mean, n = 6)
Measured on: FDA Total Diet Study FY2018-2020, TDS food 412 'Mango, fresh/frozen' (pooled), US, 6 samples, 5 detects, reporting limit 1 ppb, max 6 ppb. Health Canada's TDS has no mango code (term search 0 records).
 Almond drink, unsweetened, fortified
Nothing to watch: under the limit for a 250 g serving
More than anyone eatsNo realistic amount reaches the limit.Eating it daily comes to 1,750 g a week, which stays within the 22,000 g of room left before the limit.0.575 µg (at the quantification limit, so an upper bound) per 250 g servingRedan 2023 · grade A ?
How it’s rated
The counted figure is 22,000 g a week, about 13 servings a day.
A daily serving adds 3.2% to an average adult's cadmium intake (EFSA 2012 adult median, 1.77 µg/kg body weight/week; Canadian adults in 2007: 1.2-1.75), far from doubling it, so no cap.
Intake: one 250 mL serving (250 g) a day, 70 kg adult · Level in the food: 2.3 µg/kg (upper bound: the paper states only that the mean of almond drinks (18 product units, 3 brands) is below 2.3 µg/kg, its quantification limit; sub-quantification limit values were imputed at quantification limit/2 in its statistics; no count of quantifiable units is given, n = 18)
Measured on: FDA, US retail plant-based milk alternatives, 2023 paper (Redan et al.), ICP-MS after microwave digestion; almond type = 18 product units of 3 brands; quantification limit (quantification limit) for cadmium 2.3 µg/kg; wording: all non-soy types below 2.3 µg/kg (the almond subset is not reported separately beyond that)
 Oat drink, unsweetened, fortified
Nothing to watch: under the limit for a 250 g serving
More than anyone eatsNo realistic amount reaches the limit.Eating it daily comes to 1,750 g a week, which stays within the 22,000 g of room left before the limit.0.575 µg (at the quantification limit, so an upper bound) per 250 g servingRedan 2023 · grade A ?
How it’s rated
The counted figure is 22,000 g a week, about 13 servings a day.
A daily serving adds 3.2% to an average adult's cadmium intake (EFSA 2012 adult median, 1.77 µg/kg body weight/week; Canadian adults in 2007: 1.2-1.75), far from doubling it, so no cap.
Intake: one 250 mL serving (250 g) a day, 70 kg adult · Level in the food: 2.3 µg/kg (upper bound: the paper states only that the mean of oat drinks (12 product units, 3 brands) is below 2.3 µg/kg, its quantification limit; sub-quantification limit values were imputed at quantification limit/2 in its statistics; no count of quantifiable units is given, n = 12)
Measured on: FDA, US retail plant-based milk alternatives, 2023 paper (Redan et al.), ICP-MS; oat type = 12 product units of 3 brands; quantification limit (quantification limit) for cadmium 2.3 µg/kg; wording: all non-soy types below 2.3 µg/kg
 Green peas, cooked
Nothing to watch: under the limit for a 85 g serving
More than anyone eatsNo realistic amount reaches the limit.Eating it daily comes to 595 g a week, which stays within the 23,000 g of room left before the limit.0.192 µg per 85 g servingHealth Canada Total Diet Study, trace elements · grade A ?
How it’s rated
The counted figure is 23,000 g a week, about 38 servings a day.
A daily serving adds 1.1% to an average adult's cadmium intake (EFSA 2012 adult median, 1.77 µg/kg body weight/week; Canadian adults in 2007: 1.2-1.75), far from doubling it, so no cap.
Intake: one 85 g serving a day, 70 kg adult · Level in the food: 2.264 µg/kg (mean, n = 16)
Measured on: food-specific: Health Canada TDS food GG14 'Peas (Cooked from frozen and canned)', 16 composites 2000-2018; the composite pools frozen and canned peas, so it is not frozen-only
 Cod, baked
Nothing to watch: under the limit for a 100 g serving
More than anyone eatsNo realistic amount reaches the limit.Eating it daily comes to 700 g a week, which stays within the 23,000 g of room left before the limit.0.22 µg per 100 g servingUS FDA Total Diet Study (2018–2020) · grade A ?
How it’s rated
The counted figure is 23,000 g a week, about 33 servings a day.
A daily serving adds 1.2% to an average adult's cadmium intake (EFSA 2012 adult median, 1.77 µg/kg body weight/week; Canadian adults in 2007: 1.2-1.75), far from doubling it, so no cap.
Intake: 100 g cooked serving (HC TRA I.3) · Level in the food: 2.2 ppb (mean (27 composites; 16 detected, 11 non-detects; standard deviation 2.9, max 11 ppb), n = 27)
Measured on: US FDA Total Diet Study FY2018-2020, TDS food 387 'Cod, baked', reporting limit 1 ppb
 Cucumber, raw
Nothing to watch: under the limit for a 85 g serving
More than anyone eatsNo realistic amount reaches the limit.Eating it daily comes to 595 g a week, which stays within the 23,000 g of room left before the limit.0.185 µg per 85 g servingHealth Canada Total Diet Study, trace elements · grade B ?
How it’s rated
The counted figure is 23,000 g a week, about 39 servings a day.
A daily serving adds 1% to an average adult's cadmium intake (EFSA 2012 adult median, 1.77 µg/kg body weight/week; Canadian adults in 2007: 1.2-1.75), far from doubling it, so no cap.
Intake: one serving a day, 70 kg adult · Level in the food: 2.18 ng/g (mean (equal-weight of composites; 2000-2012 and 2016-2018 sets pooled by n), n = 16)
Measured on: Health Canada Total Diet Study trace elements, TDS food GG10 'Cucumbers (Fresh and pickled cucumber)': 13 composites 2000-2012 (2.283 ng/g) and 3 composites 2016-2018 (1.713 ng/g), as consumed, no non-detects.
 Ice cream, vanilla
Nothing to watch: under the limit for a 105 g serving
More than anyone eatsNo realistic amount reaches the limit.Eating it daily comes to 734 g a week, which stays within the 24,000 g of room left before the limit.0.227 µg per 105 g servingHealth Canada Total Diet Study, trace elements · grade A ?
How it’s rated
The counted figure is 24,000 g a week, about 32 servings a day.
A daily serving adds 2.3% to an average adult's cadmium intake (EFSA 2012 adult median, 1.77 µg/kg body weight/week; Canadian adults in 2007: 1.2-1.75), far from doubling it, so no cap.
Intake: one 188 mL (3/4 cup; 104.9 g) serving, 70 kg adult (Health Canada TRA E.1) · Level in the food: 2.163 µg/kg (mean (equal-weight, 16 composites, two era rows combined), n = 16)
Measured on: Health Canada Total Diet Study trace elements, TDS food AA07 Ice cream (vanilla and chocolate), as consumed, ng/g = µg/kg; Canada. AA07 Ice cream (vanilla and chocolate), 2000-2012: n = 13, 0 non-detects, mean 1.871 ng/g; AA07 .../Crème glacée (vanille et chocolat), 2016-2018: n = 3, 0 non-detects, mean 3.426 ng/g; combined equal-weight per composite.
 Butternut squash, baked
Nothing to watch: under the limit for a 85 g serving
More than anyone eatsNo realistic amount reaches the limit.Eating it daily comes to 595 g a week, which stays within the 24,000 g of room left before the limit.0.178 µg per 85 g servingUS FDA Total Diet Study (2018–2020) · grade A ?
How it’s rated
The counted figure is 24,000 g a week, about 41 servings a day.
A daily serving adds 1% to an average adult's cadmium intake (EFSA 2012 adult median, 1.77 µg/kg body weight/week; Canadian adults in 2007: 1.2-1.75), far from doubling it, so no cap.
Intake: one 85 g serving a day (HC TRA V.1), 70 kg adult · Level in the food: 2.1 µg/kg (mean (standard deviation 1.2, max 4.4, 25 of 27 detects, reporting limit 1 ppb), n = 27)
Measured on: US FDA Total Diet Study FY2018-FY2020, TDS food 126 "Squash, winter, fresh/frozen, boiled", n 27 samples, United States. BOILED not baked (no baked winter-squash entry in the elements summary); the summary prints mean N/A when all 27 are non-detects, and does not state how non-detects enter a partial mean.
 Farmed salmon, cooked
Nothing to watch: under the limit for a 100 g serving
More than anyone eatsNo realistic amount reaches the limit.Eating it daily comes to 700 g a week, which stays within the 24,000 g of room left before the limit.0.21 µg (at the upper-bound mean, 2.1 µg/kg) per 100 g servingUS FDA Total Diet Study (2018–2020) · grade A ?
How it’s rated
The counted figure is 24,000 g a week, about 35 servings a day.
A daily serving adds 0.9% to an average adult's cadmium intake (EFSA 2012 adult median, 1.77 µg/kg body weight/week; Canadian adults in 2007: 1.2-1.75), far from doubling it, so no cap.
Intake: one 100 g serving a day, 70 kg adult · Level in the food: 1.6 µg/kg (mean, n = 27)
Measured on: food-specific: salmon steaks/fillets, baked (FDA TDS #318, FY2018-2020), 27 samples
 Soybean oil
Nothing to watch: under the limit for a 9.2 g serving
More than anyone eatsNo realistic amount reaches the limit.Eating it daily comes to 64 g a week, which stays within the 26,000 g of room left before the limit.0.018 µg (at the 2 ppb reporting limit) per 9.2 g servingUS FDA Total Diet Study (2018–2020) · grade A ?
How it’s rated
The counted figure is 26,000 g a week, about 396 servings a day.
A daily serving adds 0.1% to an average adult's cadmium intake (EFSA 2012 adult median, 1.77 µg/kg body weight/week; Canadian adults in 2007: 1.2-1.75), far from doubling it, so no cap.
Intake: one 9.21 g (10 mL) serving a day, 70 kg adult · Level in the food: 2 ppb (all 3 composites non-detect; the value stored is the reporting limit (2 ppb), which is the upper bound, n = 3)
Measured on: FDA Total Diet Study FY2018-2020, food #379 'Oil, vegetable', 3 composites; 0 detects; reporting limit 2 ppb
1 other measurement of this food
- Health Canada TDS 2000-18, cooking fats and oils (with lard)
Nothing to watch: under the limit
More than anyone eatsNo realistic amount reaches the limit.Eating it daily comes to 64 g a week, which stays within the 260,000 g of room left before the limit.0.0018 µg (mean, non-detects counted as zero) per 9.2 g servingHealth Canada Total Diet Study, trace elements · grade B ?
How it’s rated
The counted figure is 260,000 g a week, about 4,061 servings a day.
A daily serving adds 0.01% to an average adult's cadmium intake (EFSA 2012 adult median, 1.77 µg/kg body weight/week; Canadian adults in 2007: 1.2-1.75), far from doubling it, so no cap.
Intake: one 9.21 g (10 mL) serving a day, 70 kg adult · Level in the food: 0.195 ng/g (mean (equal-weight), n = 16)
Measured on: Health Canada Total Diet Study, food II01 'Cooking Fats and salad oils (Lard, vegetable shortening, canola, and corn)', 16 composites 2000-2018 (Ottawa, St. John's, Vancouver, Montreal, Winnipeg, Toronto, Halifax, Quebec City, Calgary), as consumed. A CATEGORY: it mixes lard and shortening with canola and corn oil; it holds no soybean or sunflower item and is not an oil-only figure. Same category figure applies to all four oil rows (attached once, here).
 Ranch dressing
Nothing to watch: under the limit for a 30.4 g serving
More than anyone eatsNo realistic amount reaches the limit.Eating it daily comes to 213 g a week, which stays within the 26,000 g of room left before the limit.0.059 µg per 30.4 g servingHealth Canada Total Diet Study, trace elements · grade B ?
How it’s rated
The counted figure is 26,000 g a week, about 123 servings a day.
A daily serving adds 0.34% to an average adult's cadmium intake (EFSA 2012 adult median, 1.77 µg/kg body weight/week; Canadian adults in 2007: 1.2-1.75), far from doubling it, so no cap.
Intake: one 30.4 g (30 mL) serving a day, 70 kg adult · Level in the food: 1.951 ng/g (mean (equal-weight of composites; 2008-2012 and 2016-2018 sets pooled by n), n = 8)
Measured on: Health Canada Total Diet Study, food II07 'Salad Dressing' (the 2016-2018 label reads 'Ranch, caesar, and balsamic'), as consumed, Canada: 5 composites 2008-2012 (mean 1.883 ng/g) and 3 composites 2016-2018 (2.064), no non-detects, pooled as (5 x 1.883 + 3 x 2.064) / 8. Matched on the term 'salad dressing'. A CATEGORY item (ranch, caesar, balsamic), which is why it serves the whole dressing category.
 Breakfast cereal
Nothing to watch: under the limit for a 30 g serving
More than anyone eatsNo realistic amount reaches the limit.Eating it daily comes to 210 g a week, which stays within the 27,000 g of room left before the limit.0.058 µg per 30 g servingHealth Canada Total Diet Study, trace elements · grade A ?
How it’s rated
The counted figure is 27,000 g a week, about 127 servings a day.
A daily serving adds 0.32% to an average adult's cadmium intake (EFSA 2012 adult median, 1.77 µg/kg body weight/week; Canadian adults in 2007: 1.2-1.75), far from doubling it, so no cap.
Intake: one 30 g serving a day (Health Canada reference amount C.3), 70 kg adult · Level in the food: 1.916 ng/g (mean, n = 16)
Measured on: Health Canada TDS FF06 "Cereal, corn (Corn flake type cereal)" (Food Name "Cold Cereals, Corn Based"), 16 composites 2000-2018 (one per year per city), as consumed, all detected: corn-flake-type cereal
8 other measurements of this food
- US FDA TDS 2018-20, frosted shredded wheat
Nothing to watch: under the limit
1,300greaches the limit in a weekafter what an average adult already eats4,400 g eaten alone, from zeroEating it daily comes to 210 g a week, which stays within the 1,300 g of room left before the limit.1.2 µg per 30 g servingUS FDA Total Diet Study (2018–2020) · grade A ?
How it’s rated
A daily serving adds 6.8% to an average adult's cadmium intake (EFSA 2012 adult median, 1.77 µg/kg body weight/week; Canadian adults in 2007: 1.2-1.75), far from doubling it, so no cap.
Intake: one 30 g serving a day (Health Canada reference amount C.3), 70 kg adult · Level in the food: 40 ppb (mean, n = 3)
Measured on: FDA TDS FY2018-2020 #514 "Cereal, shredded wheat, frosted", n = 3 samples, dry cereal (preparation not stated in the sheet; no milk)
- Health Canada TDS 2000-18, rice and bran cereals (mixed)
Nothing to watch: under the limit
1,300greaches the limit in a weekafter what an average adult already eats4,500 g eaten alone, from zeroEating it daily comes to 210 g a week, which stays within the 1,300 g of room left before the limit.1.177 µg per 30 g servingHealth Canada Total Diet Study, trace elements · grade A ?
How it’s rated
A daily serving adds 6.7% to an average adult's cadmium intake (EFSA 2012 adult median, 1.77 µg/kg body weight/week; Canadian adults in 2007: 1.2-1.75), far from doubling it, so no cap.
Intake: one 30 g serving a day (Health Canada reference amount C.3), 70 kg adult · Level in the food: 39.25 ng/g (mean, n = 16)
Measured on: Health Canada TDS FF08 "Cereals, rice & bran (Rice crispies, all-bran, and raisin bran)" (Food Name "Cereal, Rice, Bran"; a composite, no single grain), 16 composites 2000-2018 (one per year per city), as consumed, all detected: rice crispies, all-bran and raisin bran in one composite; do not attribute to rice or to bran alone
- US FDA TDS 2018-20, bran with raisins
Nothing to watch: under the limit
1,300greaches the limit in a weekafter what an average adult already eats4,600 g eaten alone, from zeroEating it daily comes to 210 g a week, which stays within the 1,300 g of room left before the limit.1.14 µg per 30 g servingUS FDA Total Diet Study (2018–2020) · grade A ?
How it’s rated
A daily serving adds 6.4% to an average adult's cadmium intake (EFSA 2012 adult median, 1.77 µg/kg body weight/week; Canadian adults in 2007: 1.2-1.75), far from doubling it, so no cap.
Intake: one 30 g serving a day (Health Canada reference amount C.3), 70 kg adult · Level in the food: 38 ppb (mean, n = 3)
Measured on: FDA TDS FY2018-2020 #74 "Cereal, bran with raisins", n = 3 samples, dry cereal (preparation not stated in the sheet; no milk)
- US FDA TDS 2018-20, crisped rice
Nothing to watch: under the limit
2,300greaches the limit in a weekafter what an average adult already eats8,000 g eaten alone, from zeroEating it daily comes to 210 g a week, which stays within the 2,300 g of room left before the limit.0.66 µg per 30 g servingUS FDA Total Diet Study (2018–2020) · grade A ?
How it’s rated
A daily serving adds 3.7% to an average adult's cadmium intake (EFSA 2012 adult median, 1.77 µg/kg body weight/week; Canadian adults in 2007: 1.2-1.75), far from doubling it, so no cap.
Intake: one 30 g serving a day (Health Canada reference amount C.3), 70 kg adult · Level in the food: 22 ppb (mean, n = 3)
Measured on: FDA TDS FY2018-2020 #75 "Cereal, crisped rice", n = 3 samples, dry cereal (preparation not stated in the sheet; no milk)
- US FDA TDS 2018-20, oat rings
Nothing to watch: under the limit
2,600greaches the limit in a weekafter what an average adult already eats8,800 g eaten alone, from zeroEating it daily comes to 210 g a week, which stays within the 2,600 g of room left before the limit.0.6 µg per 30 g servingUS FDA Total Diet Study (2018–2020) · grade A ?
How it’s rated
A daily serving adds 3.4% to an average adult's cadmium intake (EFSA 2012 adult median, 1.77 µg/kg body weight/week; Canadian adults in 2007: 1.2-1.75), far from doubling it, so no cap.
Intake: one 30 g serving a day (Health Canada reference amount C.3), 70 kg adult · Level in the food: 20 ppb (mean, n = 3)
Measured on: FDA TDS FY2018-2020 #77 "Cereal, oat ring", n = 3 samples, dry cereal (preparation not stated in the sheet; no milk)
- US FDA TDS 2018-20, granola
Nothing to watch: under the limit
3,200greaches the limit in a weekafter what an average adult already eats11,000 g eaten alone, from zeroEating it daily comes to 210 g a week, which stays within the 3,200 g of room left before the limit.0.48 µg per 30 g servingUS FDA Total Diet Study (2018–2020) · grade A ?
How it’s rated
A daily serving adds 2.7% to an average adult's cadmium intake (EFSA 2012 adult median, 1.77 µg/kg body weight/week; Canadian adults in 2007: 1.2-1.75), far from doubling it, so no cap.
Intake: one 30 g serving a day (Health Canada reference amount C.3), 70 kg adult · Level in the food: 16 ppb (mean, n = 3)
Measured on: FDA TDS FY2018-2020 #512 "Cereal, granola", n = 3 samples, dry cereal (preparation not stated in the sheet; no milk)
- US FDA TDS 2018-20, honey oat rings
Nothing to watch: under the limit
3,900greaches the limit in a weekafter what an average adult already eats13,000 g eaten alone, from zeroEating it daily comes to 210 g a week, which stays within the 3,900 g of room left before the limit.0.39 µg per 30 g servingUS FDA Total Diet Study (2018–2020) · grade A ?
How it’s rated
A daily serving adds 2.2% to an average adult's cadmium intake (EFSA 2012 adult median, 1.77 µg/kg body weight/week; Canadian adults in 2007: 1.2-1.75), far from doubling it, so no cap.
Intake: one 30 g serving a day (Health Canada reference amount C.3), 70 kg adult · Level in the food: 13 ppb (mean, n = 3)
Measured on: FDA TDS FY2018-2020 #513 "Cereal, oat ring, honey", n = 3 samples, dry cereal (preparation not stated in the sheet; no milk)
- US FDA TDS 2018-20, corn flakes
Nothing to watch: under the limit
More than anyone eatsNo realistic amount reaches the limit.Eating it daily comes to 210 g a week, which stays within the 39,000 g of room left before the limit.0.039 µg per 30 g servingUS FDA Total Diet Study (2018–2020) · grade A ?
How it’s rated
The counted figure is 39,000 g a week, about 187 servings a day.
A daily serving adds 0.22% to an average adult's cadmium intake (EFSA 2012 adult median, 1.77 µg/kg body weight/week; Canadian adults in 2007: 1.2-1.75), far from doubling it, so no cap.
Intake: one 30 g serving a day (Health Canada reference amount C.3), 70 kg adult · Level in the food: 1.3 ppb (mean, n = 3)
Measured on: FDA TDS FY2018-2020 #71 "Cereal, corn flakes", n = 3 samples, dry cereal (preparation not stated in the sheet; no milk)
 Processed cheese slices
Nothing to watch: under the limit for a 30 g serving
More than anyone eatsNo realistic amount reaches the limit.Eating it daily comes to 210 g a week, which stays within the 30,000 g of room left before the limit.0.051 µg per 30 g servingHealth Canada Total Diet Study, trace elements · grade A ?
How it’s rated
The counted figure is 30,000 g a week, about 143 servings a day.
A daily serving adds 0.29% to an average adult's cadmium intake (EFSA 2012 adult median, 1.77 µg/kg body weight/week; Canadian adults in 2007: 1.2-1.75), far from doubling it, so no cap.
Intake: one 30 g serving, 70 kg adult (Health Canada TRA D.1) · Level in the food: 1.699 µg/kg (mean (equal-weight, 16 composites, two era rows combined), n = 16)
Measured on: Health Canada Total Diet Study trace elements, TDS food AA11 Cheese, processed, as consumed, ng/g = µg/kg; Canada. AA11 Cheese, processed (2000-2012): n = 13, 0 non-detects, mean 1.667 ng/g; AA11 Cheese, processed/Fromage fondu (2016-2018): n = 3, 0 non-detects, mean 1.84 ng/g; combined equal-weight per composite.
 Bacon, pan-fried
Nothing to watch: under the limit for a 15 g serving
More than anyone eatsNo realistic amount reaches the limit.Eating it daily comes to 105 g a week, which stays within the 32,000 g of room left before the limit.0.024 µg per 15 g servingUS FDA Total Diet Study (2018–2020) · grade A ?
How it’s rated
The counted figure is 32,000 g a week, about 304 servings a day.
A daily serving adds 0.14% to an average adult's cadmium intake (EFSA 2012 adult median, 1.77 µg/kg body weight/week; Canadian adults in 2007: 1.2-1.75), far from doubling it, so no cap.
Intake: one 15 g reference serving a day, 70 kg adult · Level in the food: 1.6 µg/kg (mean of 27 composites (FDA; ppb = µg/kg), n = 27)
Measured on: US FDA Total Diet Study FY2018-2020, TDS food 20 'Pork bacon, oven-cooked', n 27 composites, as prepared; non-detects counted as zero (inferred, see notes); 14 detects, 13 non-detects, max 11 ppb, RL 1 ppb, standard deviation 2.5
 Brazil nuts, raw
Nothing to watch: under the limit for a 30 g serving
More than anyone eatsNo realistic amount reaches the limit.Eating it daily comes to 210 g a week, which stays within the 32,000 g of room left before the limit.0.048 µg per 30 g servingBielecka 2021 · grade B ?
How it’s rated
The counted figure is 32,000 g a week, about 153 servings a day.
A daily serving adds 0.27% to an average adult's cadmium intake (EFSA 2012 adult median, 1.77 µg/kg body weight/week; Canadian adults in 2007: 1.2-1.75), far from doubling it, so no cap.
Intake: 30 g shelled serving (HC TRA O.1) · Level in the food: 1.59 µg/kg (mean ± standard deviation 1.59 ± 1.43 (range 0.36-5.15; median 1.29, Q1-Q3 0.44-1.84), n = 10)
Measured on: Polish retail survey (Bielecka 2021), Brazil nuts, 10 samples, GFAAS with detection limit (detection limit) 0.02 µg/kg for Cd; weight basis not stated; Poland
 Corn tortillas
Nothing to watch: under the limit for a 55 g serving
More than anyone eatsNo realistic amount reaches the limit.Eating it daily comes to 385 g a week, which stays within the 34,000 g of room left before the limit.0.08 µg per 55 g servingUS FDA Total Diet Study (2018–2020) · grade A ?
How it’s rated
The counted figure is 34,000 g a week, about 88 servings a day.
A daily serving adds 0.45% to an average adult's cadmium intake (EFSA 2012 adult median, 1.77 µg/kg body weight/week; Canadian adults in 2007: 1.2-1.75), far from doubling it, so no cap.
Intake: one 55 g serving a day, 70 kg adult · Level in the food: 1.5 µg/kg (mean, n = 27)
Measured on: food-specific: corn tortilla (FDA TDS #400)
 Lentils, cooked
Nothing to watch: under the limit for a 105 g serving
More than anyone eatsNo realistic amount reaches the limit.Eating it daily comes to 732 g a week, which stays within the 34,000 g of room left before the limit.0.16 µg per 105 g servingUS FDA Total Diet Study (2018–2020) · grade B ?
How it’s rated
The counted figure is 34,000 g a week, about 47 servings a day.
A daily serving adds 0.89% to an average adult's cadmium intake (EFSA 2012 adult median, 1.77 µg/kg body weight/week; Canadian adults in 2007: 1.2-1.75), far from doubling it, so no cap.
Intake: one 105 g serving a day, 70 kg adult · Level in the food: 1.5 µg/kg (single sample, n = 1)
Measured on: food-specific but one sample: FDA TDS #546 'Lentils, dry, cooked'. Health Canada TDS has no lentil or dried-legume composite
 Orange juice
Nothing to watch: under the limit for a 262 g serving
More than anyone eatsNo realistic amount reaches the limit.Eating it daily comes to 1,834 g a week, which stays within the 38,000 g of room left before the limit.0.353 µg per 262 g servingHealth Canada Total Diet Study, trace elements · grade A ?
How it’s rated
The counted figure is 38,000 g a week, about 21 servings a day.
A daily serving adds 2% to an average adult's cadmium intake (EFSA 2012 adult median, 1.77 µg/kg body weight/week; Canadian adults in 2007: 1.2-1.75), far from doubling it, so no cap.
Intake: one 250 mL glass (262 g) a day, 70 kg adult · Level in the food: 1.349 µg/kg (mean (pooled by sample count), n = 16)
Measured on: Health Canada TDS HH08 Citrus juice, frozen (Orange Juice, frozen conc), as consumed: 13 composites 2000-2012 mean 0.4575 ng/g (2 non-detects) plus 3 composites 1999/2016-2018 under the bilingual label mean 5.211 ng/g (2 non-detects); pooled by sample count. Juice made from frozen concentrate, reconstituted: the as-consumed basis.
 Chickpeas, cooked
Nothing to watch: under the limit for a 87 g serving
More than anyone eatsNo realistic amount reaches the limit.Eating it daily comes to 609 g a week, which stays within the 39,000 g of room left before the limit.0.113 µg per 87 g servingUS FDA Total Diet Study (2018–2020) · grade B ?
How it’s rated
The counted figure is 39,000 g a week, about 65 servings a day.
A daily serving adds 0.64% to an average adult's cadmium intake (EFSA 2012 adult median, 1.77 µg/kg body weight/week; Canadian adults in 2007: 1.2-1.75), far from doubling it, so no cap.
Intake: one 87 g serving a day, 70 kg adult · Level in the food: 1.3 µg/kg (single sample, n = 1)
Measured on: FDA TDS #545 (canned chickpeas applied to boiled weight: same species, different preparation); n = 1, detected; no chickpea composite exists in the Health Canada TDS
 Chickpeas, canned
Nothing to watch: under the limit for a 82 g serving
More than anyone eatsNo realistic amount reaches the limit.Eating it daily comes to 574 g a week, which stays within the 39,000 g of room left before the limit.0.107 µg per 82 g servingUS FDA Total Diet Study (2018–2020) · grade B ?
How it’s rated
The counted figure is 39,000 g a week, about 68 servings a day.
A daily serving adds 0.6% to an average adult's cadmium intake (EFSA 2012 adult median, 1.77 µg/kg body weight/week; Canadian adults in 2007: 1.2-1.75), far from doubling it, so no cap.
Intake: one 82 g serving a day, 70 kg adult · Level in the food: 1.3 µg/kg (single sample, n = 1)
Measured on: FDA TDS #545 (food-specific: chickpeas, canned, drained solids); n = 1, detected; no chickpea composite exists in the Health Canada TDS
 Hummus
Nothing to watch: under the limit for a 30 g serving
More than anyone eatsNo realistic amount reaches the limit.Eating it daily comes to 210 g a week, which stays within the 39,000 g of room left before the limit.0.04 µg (30 g × 1.3 µg/kg; chickpea part only) per 30 g servingUS FDA Total Diet Study (2018–2020) · grade B ?
How it’s rated
The counted figure is 39,000 g a week, about 187 servings a day.
A daily serving adds 0.22% to an average adult's cadmium intake (EFSA 2012 adult median, 1.77 µg/kg body weight/week; Canadian adults in 2007: 1.2-1.75), far from doubling it, so no cap.
Intake: one 30 g serving a day, 70 kg adult · Level in the food: 1.3 µg/kg (single sample, n = 1)
Measured on: chickpea component only: FDA TDS FY2018-2020, canned chickpeas, single sample (n 1); hummus itself and its tahini part are not covered
 Cheddar
Nothing to watch: under the limit for a 30 g serving
More than anyone eatsNo realistic amount reaches the limit.Eating it daily comes to 210 g a week, which stays within the 41,000 g of room left before the limit.0.037 µg per 30 g servingHealth Canada Total Diet Study, trace elements · grade A ?
How it’s rated
The counted figure is 41,000 g a week, about 196 servings a day.
A daily serving adds 0.21% to an average adult's cadmium intake (EFSA 2012 adult median, 1.77 µg/kg body weight/week; Canadian adults in 2007: 1.2-1.75), far from doubling it, so no cap.
Intake: one 30 g serving a day, 70 kg adult · Level in the food: 1.239 µg/kg (mean, n = 16)
Measured on: food-specific: HC TDS AA09 'Cheese (cheddar and mozzarella)', 16 composites 2000-2018
 Mozzarella, part-skim
Nothing to watch: under the limit for a 30 g serving
More than anyone eatsNo realistic amount reaches the limit.Eating it daily comes to 210 g a week, which stays within the 41,000 g of room left before the limit.0.037 µg per 30 g servingHealth Canada Total Diet Study, trace elements · grade A ?
How it’s rated
The counted figure is 41,000 g a week, about 196 servings a day.
A daily serving adds 0.21% to an average adult's cadmium intake (EFSA 2012 adult median, 1.77 µg/kg body weight/week; Canadian adults in 2007: 1.2-1.75), far from doubling it, so no cap.
Intake: one 30 g serving a day, 70 kg adult · Level in the food: 1.239 µg/kg (mean, n = 16)
Measured on: food-specific: HC TDS AA09 'Cheese (cheddar and mozzarella)', 16 composites 2000-2018
 Swiss cheese
Nothing to watch: under the limit for a 30 g serving
More than anyone eatsNo realistic amount reaches the limit.Eating it daily comes to 210 g a week, which stays within the 41,000 g of room left before the limit.0.037 µg per 30 g servingHealth Canada Total Diet Study, trace elements · grade B ?
How it’s rated
The counted figure is 41,000 g a week, about 196 servings a day.
A daily serving adds 0.21% to an average adult's cadmium intake (EFSA 2012 adult median, 1.77 µg/kg body weight/week; Canadian adults in 2007: 1.2-1.75), far from doubling it, so no cap.
Intake: one 30 g serving a day, 70 kg adult · Level in the food: 1.239 µg/kg (mean, n = 16)
Measured on: related food: HC TDS AA09 'Cheese (cheddar and mozzarella)' applied to Swiss (not a named TDS item; may err low for a drier cheese)
 Parmesan
Nothing to watch: under the limit for a 15 g serving
More than anyone eatsNo realistic amount reaches the limit.Eating it daily comes to 105 g a week, which stays within the 41,000 g of room left before the limit.0.019 µg per 15 g servingHealth Canada Total Diet Study, trace elements · grade B ?
How it’s rated
The counted figure is 41,000 g a week, about 393 servings a day.
A daily serving adds 0.11% to an average adult's cadmium intake (EFSA 2012 adult median, 1.77 µg/kg body weight/week; Canadian adults in 2007: 1.2-1.75), far from doubling it, so no cap.
Intake: one 15.0 g serving a day, 70 kg adult · Level in the food: 1.239 µg/kg (mean, n = 16)
Measured on: related food: HC TDS AA09 'Cheese (cheddar and mozzarella)' applied to parmesan (not a named TDS item; may err low for a drier cheese)
 Feta
Nothing to watch: under the limit for a 30 g serving
More than anyone eatsNo realistic amount reaches the limit.Eating it daily comes to 210 g a week, which stays within the 41,000 g of room left before the limit.0.037 µg per 30 g servingHealth Canada Total Diet Study, trace elements · grade B ?
How it’s rated
The counted figure is 41,000 g a week, about 196 servings a day.
A daily serving adds 0.21% to an average adult's cadmium intake (EFSA 2012 adult median, 1.77 µg/kg body weight/week; Canadian adults in 2007: 1.2-1.75), far from doubling it, so no cap.
Intake: one 30 g serving a day, 70 kg adult · Level in the food: 1.239 µg/kg (mean, n = 16)
Measured on: related food: HC TDS AA09 'Cheese (cheddar and mozzarella)' applied to feta (not a named TDS item; may err low for a drier cheese)
 Peaches, raw
Nothing to watch: under the limit for a 140 g serving
More than anyone eatsNo realistic amount reaches the limit.Eating it daily comes to 980 g a week, which stays within the 44,000 g of room left before the limit.0.164 µg per 140 g servingHealth Canada Total Diet Study, trace elements · grade A ?
How it’s rated
The counted figure is 44,000 g a week, about 44 servings a day.
A daily serving adds 0.93% to an average adult's cadmium intake (EFSA 2012 adult median, 1.77 µg/kg body weight/week; Canadian adults in 2007: 1.2-1.75), far from doubling it, so no cap.
Intake: one 140 g serving a day (HC TRA J.1), 70 kg adult · Level in the food: 1.172 ng/g (mean of 16 single-year composites (equal weight), n = 16)
Measured on: Health Canada Total Diet Study, food code HH13 "Peaches" (the pack gives no fresh/canned qualifier), As consumed, composites of 2000-2012 and 2016-2018 (16 single-year composites), Canada; equal-weight mean; non-detects stored as 0; the 1993-99 pooled composite is a separate row and is not averaged in
 Pears, raw
Nothing to watch: under the limit for a 140 g serving
More than anyone eatsNo realistic amount reaches the limit.Eating it daily comes to 980 g a week, which stays within the 46,000 g of room left before the limit.0.156 µg per 140 g servingHealth Canada Total Diet Study, trace elements · grade A ?
How it’s rated
The counted figure is 46,000 g a week, about 47 servings a day.
A daily serving adds 0.88% to an average adult's cadmium intake (EFSA 2012 adult median, 1.77 µg/kg body weight/week; Canadian adults in 2007: 1.2-1.75), far from doubling it, so no cap.
Intake: one 140 g serving a day (HC TRA J.1), 70 kg adult · Level in the food: 1.116 ng/g (mean of single-year composites, n-weighted over two sets (1.134 n 13; 1.038 n 3), n = 16)
Measured on: Health Canada Total Diet Study, food code HH14 Pears (set 1 "Fresh, raw pears" 2000-2012, set 2 "Fresh, raw" 2016-2018), As consumed, Canada; the two single-year sets are combined here by composite count (n-weighted); non-detects stored as 0; the 1993-99 pooled composite is a separate row and is not averaged in
- Kidney beans, canned
Nothing to watch: under the limit
More than anyone eatsNo realistic amount reaches the limit.US FDA Total Diet Study (2018–2020) · grade A ?
How it’s rated
The counted figure is 51,000 g a week, about 7,300 servings a day.
A daily serving adds 0.56% to an average adult's cadmium intake (EFSA 2012 adult median, 1.77 µg/kg body weight/week; Canadian adults in 2007: 1.2-1.75), far from doubling it, so no cap.
Intake: 100 g drained beans (illustration; the weight of 125 mL is not established from the local files; per-100-g figures are shown, siblings use 90-95 g) · Level in the food: 1 ppb (reporting limit (no detects: 0 of 3; the table gives no mean), n = 3)
Measured on: food-specific: US FDA Total Diet Study FY2018-2020 elements supplement, TDS food 528 'Beans, kidney, canned, drained solids' (US, 3 samples), reporting limit 1 ppb; Health Canada TDS has no kidney-bean code (its GG01 is baked beans in sauce), so FDA is the headline for this preparation
 Pineapple, raw
Nothing to watch: under the limit for a 140 g serving
More than anyone eatsNo realistic amount reaches the limit.Eating it daily comes to 980 g a week, which stays within the 51,000 g of room left before the limit.0.14 µg per 140 g servingUS FDA Total Diet Study (2018–2020) · grade A ?
How it’s rated
The counted figure is 51,000 g a week, about 52 servings a day.
A daily serving adds 0.79% to an average adult's cadmium intake (EFSA 2012 adult median, 1.77 µg/kg body weight/week; Canadian adults in 2007: 1.2-1.75), far from doubling it, so no cap.
Intake: one 140 g serving a day, 70 kg adult · Level in the food: 1 µg/kg (mean, n = 27)
Measured on: FDA Total Diet Study FY2018-2020, TDS food 396 'Pineapple, raw/frozen' (fresh and frozen pooled), US, 27 samples, 2 detects, reporting limit 1 ppb. Health Canada's TDS has only HH15 pineapple CANNED (no fresh code), which does not match this raw form.
 Coffee creamer, flavoured liquid
Nothing to watch: under the limit for a 15.2 g serving
More than anyone eatsNo realistic amount reaches the limit.Eating it daily comes to 106 g a week, which stays within the 51,000 g of room left before the limit.0.015 µg (at the reporting limit, 1 ppb) per 15.2 g servingUS FDA Total Diet Study (2018–2020) · grade A ?
How it’s rated
The counted figure is 51,000 g a week, about 480 servings a day.
A daily serving adds 0.086% to an average adult's cadmium intake (EFSA 2012 adult median, 1.77 µg/kg body weight/week; Canadian adults in 2007: 1.2-1.75), far from doubling it, so no cap.
Intake: one 15.2 g (15 mL) serving a day, 70 kg adult · Level in the food: 1 ppb (all 3 composites non-detect; the value stored is the reporting limit (1 ppb), which is the upper bound, n = 3)
Measured on: US FDA Total Diet Study FY2018-2020, TDS food 168 'Cream substitute, non-dairy, liquid', 3 samples. The Canadian TDS has no creamer item (term 'creamer' returned no records; the nearest item, AA06 Cream, is dairy and was not used).
 Chicken breast, roasted
Nothing to watch: under the limit for a 100 g serving
More than anyone eatsNo realistic amount reaches the limit.Eating it daily comes to 700 g a week, which stays within the 53,000 g of room left before the limit.0.097 µg per 100 g servingHealth Canada Total Diet Study, trace elements · grade B ?
How it’s rated
The counted figure is 53,000 g a week, about 76 servings a day.
A daily serving adds 0.55% to an average adult's cadmium intake (EFSA 2012 adult median, 1.77 µg/kg body weight/week; Canadian adults in 2007: 1.2-1.75), far from doubling it, so no cap.
Intake: one 100 g cooked serving a day, 70 kg adult · Level in the food: 0.965 µg/kg (mean, n = 16)
Measured on: category: HC TDS CC02 'Poultry, chicken & turkey (roast chicken and turkey)', as consumed, 16 composites 2000-2018 (one city each)
 Chicken thigh, roasted
Nothing to watch: under the limit for a 100 g serving
More than anyone eatsNo realistic amount reaches the limit.Eating it daily comes to 700 g a week, which stays within the 53,000 g of room left before the limit.0.097 µg per 100 g servingHealth Canada Total Diet Study, trace elements · grade A ?
How it’s rated
The counted figure is 53,000 g a week, about 76 servings a day.
A daily serving adds 0.55% to an average adult's cadmium intake (EFSA 2012 adult median, 1.77 µg/kg body weight/week; Canadian adults in 2007: 1.2-1.75), far from doubling it, so no cap.
Intake: one 100 g cooked serving a day, 70 kg adult (Health Canada TRA L.6) · Level in the food: 0.965 ng/g (µg/kg) (mean (equal-weight over composites, both label eras pooled n-weighted), n = 16)
Measured on: Health Canada TDS CC02 "Poultry, chicken & turkey (roast chicken and turkey)", As consumed, Canada, 16 composites: 13 in 2000-2012 (mean 1.079, 1 non-detect, detection limit (detection limit) to 0.4) and 3 in 2016-2018 (mean 0.4704, none non-detect); non-detects stored as 0 in the dataset (so lower bound); detection limit range 0-0.4 ng/g; the TDS item is roast chicken AND turkey, not thigh alone
 Green beans, cooked
Nothing to watch: under the limit for a 85 g serving
More than anyone eatsNo realistic amount reaches the limit.Eating it daily comes to 595 g a week, which stays within the 53,000 g of room left before the limit.0.08 µg per 85 g servingHealth Canada Total Diet Study, trace elements · grade A ?
How it’s rated
The counted figure is 53,000 g a week, about 89 servings a day.
A daily serving adds 0.45% to an average adult's cadmium intake (EFSA 2012 adult median, 1.77 µg/kg body weight/week; Canadian adults in 2007: 1.2-1.75), far from doubling it, so no cap.
Intake: one 85 g serving a day, 70 kg adult · Level in the food: 0.96 µg/kg (mean, n = 16)
Measured on: food-specific: HC TDS GG02 (fresh cooked and canned)
 Raisins
Nothing to watch: under the limit for a 40 g serving
More than anyone eatsNo realistic amount reaches the limit.Eating it daily comes to 280 g a week, which stays within the 54,000 g of room left before the limit.0.038 µg per 40 g servingHealth Canada Total Diet Study, trace elements · grade A ?
How it’s rated
The counted figure is 54,000 g a week, about 195 servings a day.
A daily serving adds 0.21% to an average adult's cadmium intake (EFSA 2012 adult median, 1.77 µg/kg body weight/week; Canadian adults in 2007: 1.2-1.75), far from doubling it, so no cap.
Intake: one 40 g serving a day, 70 kg adult · Level in the food: 0.938 µg/kg (mean, n = 16)
Measured on: Health Canada TDS HH17 'Raisins', composites 2000-2018, cadmium n 16 (13 composites 2000-2012 mean 0.9636, one non-detect; 3 composites 2016-2018 'Raisins secs' mean 0.8282), as consumed. FDA TDS food 95 raisins: 0.33 µg/kg (n 3, 1 detect).
 Blueberries, raw
Nothing to watch: under the limit for a 80 g serving
More than anyone eatsNo realistic amount reaches the limit.Eating it daily comes to 560 g a week, which stays within the 57,000 g of room left before the limit.0.072 µg per 80 g servingHealth Canada Total Diet Study, trace elements · grade A ?
How it’s rated
The counted figure is 57,000 g a week, about 102 servings a day.
A daily serving adds 0.41% to an average adult's cadmium intake (EFSA 2012 adult median, 1.77 µg/kg body weight/week; Canadian adults in 2007: 1.2-1.75), far from doubling it, so no cap.
Intake: one 80 g serving a day, 70 kg adult · Level in the food: 0.899 µg/kg (mean, n = 16)
Measured on: food-specific: HC TDS HH05 'Blueberries / Bleuets', composites 2000-2018 (cadmium n = 16, lead n = 17 incl. one 1999 'Multiple' composite); the description does not say fresh or frozen, highbush or lowbush
 Blueberries, frozen
Nothing to watch: under the limit for a 80 g serving
More than anyone eatsNo realistic amount reaches the limit.Eating it daily comes to 560 g a week, which stays within the 57,000 g of room left before the limit.0.072 µg per 80 g servingHealth Canada Total Diet Study, trace elements · grade B ?
How it’s rated
The counted figure is 57,000 g a week, about 102 servings a day.
A daily serving adds 0.41% to an average adult's cadmium intake (EFSA 2012 adult median, 1.77 µg/kg body weight/week; Canadian adults in 2007: 1.2-1.75), far from doubling it, so no cap.
Intake: one 80 g serving a day, 70 kg adult · Level in the food: 0.899 µg/kg (mean, n = 16)
Measured on: food-specific: HC TDS HH05 'Blueberries / Bleuets', composites 2000-2018 (cadmium n = 16, lead n = 17 incl. one 1999 'Multiple' composite); the description does not say fresh or frozen, highbush or lowbush
 Wild blueberries, frozen
Nothing to watch: under the limit for a 80 g serving
More than anyone eatsNo realistic amount reaches the limit.Eating it daily comes to 560 g a week, which stays within the 57,000 g of room left before the limit.0.072 µg per 80 g servingHealth Canada Total Diet Study, trace elements · grade B ?
How it’s rated
The counted figure is 57,000 g a week, about 102 servings a day.
A daily serving adds 0.41% to an average adult's cadmium intake (EFSA 2012 adult median, 1.77 µg/kg body weight/week; Canadian adults in 2007: 1.2-1.75), far from doubling it, so no cap.
Intake: one 80 g serving a day, 70 kg adult · Level in the food: 0.899 µg/kg (mean, n = 16)
Measured on: food-specific: HC TDS HH05 'Blueberries / Bleuets', composites 2000-2018 (cadmium n = 16, lead n = 17 incl. one 1999 'Multiple' composite); the description does not say fresh or frozen, highbush or lowbush
 Ground turkey, 93% lean, cooked
Nothing to watch: under the limit for a 60 g serving
More than anyone eatsNo realistic amount reaches the limit.Eating it daily comes to 420 g a week, which stays within the 60,000 g of room left before the limit.0.051 µg per 60 g servingUS FDA Total Diet Study (2018–2020) · grade A ?
How it’s rated
The counted figure is 60,000 g a week, about 143 servings a day.
A daily serving adds 0.29% to an average adult's cadmium intake (EFSA 2012 adult median, 1.77 µg/kg body weight/week; Canadian adults in 2007: 1.2-1.75), far from doubling it, so no cap.
Intake: 60 g cooked serving (HC TRA L.7) · Level in the food: 0.85 ppb (mean (27 composites; 15 detected, 12 non-detects; standard deviation 0.84, max 2.3 ppb), n = 27)
Measured on: US FDA Total Diet Study FY2018-2020 elements supplement, TDS food 390 'Turkey, ground, pan-cooked' (as eaten, US), reporting limit 1 ppb
 Ground beef, 80% lean, cooked
Nothing to watch: under the limit for a 60 g serving
More than anyone eatsNo realistic amount reaches the limit.Eating it daily comes to 420 g a week, which stays within the 70,000 g of room left before the limit.0.044 µg per 60 g servingHealth Canada Total Diet Study, trace elements · grade A ?
How it’s rated
The counted figure is 70,000 g a week, about 166 servings a day.
A daily serving adds 0.25% to an average adult's cadmium intake (EFSA 2012 adult median, 1.77 µg/kg body weight/week; Canadian adults in 2007: 1.2-1.75), far from doubling it, so no cap.
Intake: one 60 g serving a day, 70 kg adult · Level in the food: 0.731 µg/kg (mean (equal weight), n = 16)
Measured on: food-specific: Beef Ground, Medium (Health Canada TDS BB03, 'As consumed', Ready-to-eat), 16 city composites 2000-2018
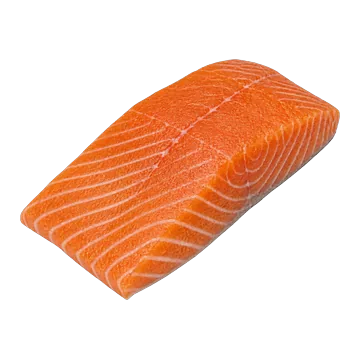 Farmed salmon, raw
Nothing to watch: under the limit for a 125 g serving
More than anyone eatsNo realistic amount reaches the limit.Eating it daily comes to 875 g a week, which stays within the 76,000 g of room left before the limit.0.084 µg (at the upper-bound mean, 0.67 µg/kg) per 125 g servingCFIA mercury and metals in fish (2000–2021) · grade A ?
How it’s rated
The counted figure is 76,000 g a week, about 87 servings a day.
A daily serving adds 0.35% to an average adult's cadmium intake (EFSA 2012 adult median, 1.77 µg/kg body weight/week; Canadian adults in 2007: 1.2-1.75), far from doubling it, so no cap.
Intake: one 125 g serving a day, 70 kg adult · Level in the food: 0.49 µg/kg (mean, n = 106)
Measured on: food-specific: Atlantic salmon muscle/meat, fresh or frozen, CFIA 2003-2021 (n = 106; 'farmed' not recorded)
 Pork chop, pan-fried
Nothing to watch: under the limit for a 100 g serving
More than anyone eatsNo realistic amount reaches the limit.Eating it daily comes to 700 g a week, which stays within the 81,000 g of room left before the limit.0.063 µg per 100 g servingHealth Canada Total Diet Study, trace elements · grade A ?
How it’s rated
The counted figure is 81,000 g a week, about 115 servings a day.
A daily serving adds 0.36% to an average adult's cadmium intake (EFSA 2012 adult median, 1.77 µg/kg body weight/week; Canadian adults in 2007: 1.2-1.75), far from doubling it, so no cap.
Intake: 100 g cooked serving (HC TRA L.6) · Level in the food: 0.633 ng/g (µg/kg) (mean (equal-weight over composites, both label eras pooled n-weighted), n = 16)
Measured on: Health Canada TDS, BB04 Pork, fresh (spareribs, chops and shoulder roast), as consumed, Canada. 13 composites 2000-2012 (mean 0.6836, 1 non-detect, detection limit (detection limit) up to 1.2 ng/g) and 3 composites 2016-2018 (mean 0.4143, 0 non-detects)
 Kiwi, raw
Nothing to watch: under the limit for a 140 g serving
More than anyone eatsNo realistic amount reaches the limit.Eating it daily comes to 980 g a week, which stays within the 84,000 g of room left before the limit.0.085 µg per 140 g servingHealth Canada Total Diet Study, trace elements · grade A ?
How it’s rated
The counted figure is 84,000 g a week, about 86 servings a day.
A daily serving adds 0.48% to an average adult's cadmium intake (EFSA 2012 adult median, 1.77 µg/kg body weight/week; Canadian adults in 2007: 1.2-1.75), far from doubling it, so no cap.
Intake: one 140 g serving a day, 70 kg adult · Level in the food: 0.605 ng/g (mean, n = 13)
Measured on: Health Canada Canadian Total Diet Study, trace elements, TDS food HH20 'Kiwi fruit (Fresh, raw kiwi)', composites 2000-2012 (13 yearly composites, 1 non-detect), as consumed. Second series 'Kiwi fruit (Fresh, raw)/Kiwis (crus et frais)' 2016-2018 (3 composites): 0.3931 ng/g, not pooled (kept in notes).
 Watermelon, raw
Nothing to watch: under the limit for a 150 g serving
More than anyone eatsNo realistic amount reaches the limit.Eating it daily comes to 1,050 g a week, which stays within the 90,000 g of room left before the limit.0.086 µg per 150 g servingUS FDA Total Diet Study (2018–2020) · grade A ?
How it’s rated
The counted figure is 90,000 g a week, about 85 servings a day.
A daily serving adds 0.48% to an average adult's cadmium intake (EFSA 2012 adult median, 1.77 µg/kg body weight/week; Canadian adults in 2007: 1.2-1.75), far from doubling it, so no cap.
Intake: one serving a day, 70 kg adult · Level in the food: 0.57 µg/kg (mean, n = 27)
Measured on: FDA Total Diet Study FY2018-2020, TDS food 81 'Watermelon, raw/frozen' (US), 27 samples, 11 detects, reporting limit 1 ppb, standard deviation 0.75, max 2.6 ppb.
 Grapes, raw
Nothing to watch: under the limit for a 140 g serving
More than anyone eatsNo realistic amount reaches the limit.Eating it daily comes to 980 g a week, which stays within the 91,000 g of room left before the limit.0.079 µg per 140 g servingHealth Canada Total Diet Study, trace elements · grade A ?
How it’s rated
The counted figure is 91,000 g a week, about 92 servings a day.
A daily serving adds 0.45% to an average adult's cadmium intake (EFSA 2012 adult median, 1.77 µg/kg body weight/week; Canadian adults in 2007: 1.2-1.75), far from doubling it, so no cap.
Intake: one 140 g serving a day, 70 kg adult · Level in the food: 0.564 µg/kg (mean, n = 16)
Measured on: Health Canada TDS HH11 'Grapes (Seedless, red and green grapes)', composites 2000-2018, cadmium n 16 (13 + 3; one non-detect), as consumed. FDA TDS food 88: cadmium not detected in 27 samples (reporting limit 1 µg/kg).
 Mayonnaise
Nothing to watch: under the limit for a 14 g serving
More than anyone eatsNo realistic amount reaches the limit.Eating it daily comes to 98 g a week, which stays within the 94,000 g of room left before the limit.0.0076 µg (mean, non-detects counted as zero) per 14 g servingHealth Canada Total Diet Study, trace elements · grade A ?
How it’s rated
The counted figure is 94,000 g a week, about 964 servings a day.
A daily serving adds 0.043% to an average adult's cadmium intake (EFSA 2012 adult median, 1.77 µg/kg body weight/week; Canadian adults in 2007: 1.2-1.75), far from doubling it, so no cap.
Intake: one 13.95 g (15 mL) serving a day, 70 kg adult · Level in the food: 0.543 ng/g (mean (equal-weight of composites; 2000-2012 and 2016-2018 sets pooled by n), n = 16)
Measured on: Health Canada Total Diet Study, food II04 'Mayonnaise', as consumed, Canada: 13 composites 2000-2012 (mean 0.525 ng/g, 1 non-detect) and 3 composites 2016-2018 (mean 0.6203, 0 non-detects), pooled as (13 x 0.525 + 3 x 0.6203) / 16. Matched on the term 'mayonnaise'. Food-specific, not a category.
 Banana, raw
Nothing to watch: under the limit for a 140 g serving
More than anyone eatsNo realistic amount reaches the limit.Eating it daily comes to 980 g a week, which stays within the 96,000 g of room left before the limit.0.074 µg per 140 g servingHealth Canada Total Diet Study, trace elements · grade A ?
How it’s rated
The counted figure is 96,000 g a week, about 98 servings a day.
A daily serving adds 0.42% to an average adult's cadmium intake (EFSA 2012 adult median, 1.77 µg/kg body weight/week; Canadian adults in 2007: 1.2-1.75), far from doubling it, so no cap.
Intake: one 140 g serving a day, 70 kg adult · Level in the food: 0.531 µg/kg (mean, n = 16)
Measured on: food-specific: HC TDS HH04 'Bananas', 16 composites 2000-2018, one non-detect (detection limit (detection limit) 0.3) stored as 0
 Butter, unsalted
Nothing to watch: under the limit for a 10 g serving
More than anyone eatsNo realistic amount reaches the limit.Eating it daily comes to 70 g a week, which stays within the 100,000 g of room left before the limit.0.00495 µg per 10 g servingHealth Canada Total Diet Study, trace elements · grade A ?
How it’s rated
The counted figure is 100,000 g a week, about 1,474 servings a day.
A daily serving adds 0.028% to an average adult's cadmium intake (EFSA 2012 adult median, 1.77 µg/kg body weight/week; Canadian adults in 2007: 1.2-1.75), far from doubling it, so no cap.
Intake: one 10.0 g serving, 70 kg adult (Health Canada TRA H.1) · Level in the food: 0.495 µg/kg (mean (equal-weight, 16 composites), n = 16)
Measured on: Health Canada Total Diet Study trace elements, TDS food AA12 'Butter (salted)', 2000-2018, as consumed, ng/g = µg/kg; no composite for 2013-2015; Canada
- Butter, salted
Nothing to watch: under the limit for a 10 g serving
More than anyone eatsNo realistic amount reaches the limit.Eating it daily comes to 70 g a week, which stays within the 100,000 g of room left before the limit.0.00495 µg per 10 g servingHealth Canada Total Diet Study, trace elements · grade A ?
How it’s rated
The counted figure is 100,000 g a week, about 1,474 servings a day.
A daily serving adds 0.028% to an average adult's cadmium intake (EFSA 2012 adult median, 1.77 µg/kg body weight/week; Canadian adults in 2007: 1.2-1.75), far from doubling it, so no cap.
Intake: one 10.0 g serving, 70 kg adult (Health Canada TRA H.1) · Level in the food: 0.495 µg/kg (mean (equal-weight, 16 composites), n = 16)
Measured on: Health Canada Total Diet Study trace elements, TDS food AA12 'Butter (salted)', 2000-2018, as consumed, ng/g = µg/kg; no composite for 2013-2015; Canada
 Eggs, raw
Nothing to watch: under the limit for a 100 g serving
More than anyone eatsNo realistic amount reaches the limit.Eating it daily comes to 700 g a week, which stays within the 130,000 g of room left before the limit.0.039 µg per 100 g servingHealth Canada Total Diet Study, trace elements · grade A ?
How it’s rated
The counted figure is 130,000 g a week, about 189 servings a day.
A daily serving adds 0.22% to an average adult's cadmium intake (EFSA 2012 adult median, 1.77 µg/kg body weight/week; Canadian adults in 2007: 1.2-1.75), far from doubling it, so no cap.
Intake: one 100 g serving a day, 70 kg adult · Level in the food: 0.387 µg/kg (mean, n = 16)
Measured on: food-specific: Health Canada TDS CC01 "Eggs, fresh", 16 composites 2000-2018, As consumed (cooking state of the composite not given in the fields read)
 Eggs, hard-boiled
Nothing to watch: under the limit for a 100 g serving
More than anyone eatsNo realistic amount reaches the limit.Eating it daily comes to 700 g a week, which stays within the 130,000 g of room left before the limit.0.039 µg per 100 g servingHealth Canada Total Diet Study, trace elements · grade A ?
How it’s rated
The counted figure is 130,000 g a week, about 189 servings a day.
A daily serving adds 0.22% to an average adult's cadmium intake (EFSA 2012 adult median, 1.77 µg/kg body weight/week; Canadian adults in 2007: 1.2-1.75), far from doubling it, so no cap.
Intake: one 100 g serving a day, 70 kg adult · Level in the food: 0.387 µg/kg (mean, n = 16)
Measured on: food-specific: Health Canada TDS CC01 "Eggs, fresh", 16 composites 2000-2018, As consumed (cooking state of the composite not given in the fields read)
 Oranges, raw
Nothing to watch: under the limit for a 140 g serving
More than anyone eatsNo realistic amount reaches the limit.Eating it daily comes to 980 g a week, which stays within the 150,000 g of room left before the limit.0.048 µg per 140 g servingHealth Canada Total Diet Study, trace elements · grade B ?
How it’s rated
The counted figure is 150,000 g a week, about 153 servings a day.
A daily serving adds 0.27% to an average adult's cadmium intake (EFSA 2012 adult median, 1.77 µg/kg body weight/week; Canadian adults in 2007: 1.2-1.75), far from doubling it, so no cap.
Intake: one 140 g serving a day, 70 kg adult · Level in the food: 0.34 µg/kg (mean (equal-weight), n = 16)
Measured on: category: HC TDS HH07 'Citrus fruit, raw (Oranges and grapefruit)', 16 composites 2000-2018 (a mixed oranges + grapefruit composite, not orange alone)
 Grapefruit, raw
Nothing to watch: under the limit for a 140 g serving
More than anyone eatsNo realistic amount reaches the limit.Eating it daily comes to 980 g a week, which stays within the 150,000 g of room left before the limit.0.048 µg per 140 g servingHealth Canada Total Diet Study, trace elements · grade A ?
How it’s rated
The counted figure is 150,000 g a week, about 153 servings a day.
A daily serving adds 0.27% to an average adult's cadmium intake (EFSA 2012 adult median, 1.77 µg/kg body weight/week; Canadian adults in 2007: 1.2-1.75), far from doubling it, so no cap.
Intake: one 140 g serving a day, 70 kg adult · Level in the food: 0.34 µg/kg (mean (pooled by sample count), n = 16)
Measured on: Health Canada TDS HH07 Citrus fruit, raw (Oranges and grapefruit), as consumed: 13 composites 2000-2012 mean 0.3597 ng/g (2 non-detects) plus 3 composites 1999/2016-2018 under the bilingual label mean 0.253 ng/g (2 non-detects); pooled by sample count. The composite names grapefruit and oranges together; grapefruit alone is not separated.
 Mandarins, raw
Nothing to watch: under the limit for a 140 g serving
More than anyone eatsNo realistic amount reaches the limit.Eating it daily comes to 980 g a week, which stays within the 150,000 g of room left before the limit.0.048 µg per 140 g servingHealth Canada Total Diet Study, trace elements · grade B ?
How it’s rated
The counted figure is 150,000 g a week, about 153 servings a day.
A daily serving adds 0.27% to an average adult's cadmium intake (EFSA 2012 adult median, 1.77 µg/kg body weight/week; Canadian adults in 2007: 1.2-1.75), far from doubling it, so no cap.
Intake: one 140 g serving a day, 70 kg adult · Level in the food: 0.34 µg/kg (mean (pooled by sample count), n = 16)
Measured on: Health Canada TDS HH07 Citrus fruit, raw (Oranges and grapefruit), as consumed: 13 composites 2000-2012 mean 0.3597 ng/g (2 non-detects) plus 3 composites 1999/2016-2018 under the bilingual label mean 0.253 ng/g (2 non-detects); pooled by sample count. PROXY: no TDS food code names mandarins; HH07 is the citrus composite 'Oranges and grapefruit', used as the nearest as-consumed citrus fruit.
 Beef steak, top loin, grilled
Nothing to watch: under the limit for a 100 g serving
More than anyone eatsNo realistic amount reaches the limit.Eating it daily comes to 700 g a week, which stays within the 160,000 g of room left before the limit.0.032 µg per 100 g servingHealth Canada Total Diet Study, trace elements · grade A ?
How it’s rated
The counted figure is 160,000 g a week, about 231 servings a day.
A daily serving adds 0.18% to an average adult's cadmium intake (EFSA 2012 adult median, 1.77 µg/kg body weight/week; Canadian adults in 2007: 1.2-1.75), far from doubling it, so no cap.
Intake: one 100 g cooked serving a day, 70 kg adult (Health Canada TRA L.6) · Level in the food: 0.316 ng/g (µg/kg) (mean (equal-weight over composites, both label eras pooled n-weighted), n = 16)
Measured on: Health Canada TDS BB01 "Beef, steak (sirloin and T-bone)", As consumed, Canada, 16 composites: 13 in 2000-2012 (mean 0.3643, no non-detects) and 3 in 2016-2018 (mean 0.1046, 1 non-detect, detection limit (detection limit) to 0.21); roast item BB02 "Beef, roast (cross rib and inside round)": pooled 0.3136, n = 16, 3 non-detects; non-detects stored as 0 in the dataset (so lower bound); detection limit range 0-0.21 ng/g
 Honey
Nothing to watch: under the limit for a 20 g serving
More than anyone eatsNo realistic amount reaches the limit.Eating it daily comes to 140 g a week, which stays within the 180,000 g of room left before the limit.0.0058 µg per 20 g servingHealth Canada Total Diet Study, trace elements · grade A ?
How it’s rated
The counted figure is 180,000 g a week, about 1,252 servings a day.
A daily serving adds 0.033% to an average adult's cadmium intake (EFSA 2012 adult median, 1.77 µg/kg body weight/week; Canadian adults in 2007: 1.2-1.75), far from doubling it, so no cap.
Intake: one 20 g serving a day (HC TRA U.8), 70 kg adult · Level in the food: 0.292 µg/kg (mean (equal-weight, 16 composites, two era rows combined: 13 composites 2000-2012 at 0.323 and 3 composites 2016-2018 at 0.155), n = 16)
Measured on: Health Canada Total Diet Study, TDS food JJ04 'Honey, bottled', as consumed, Canada, 2000-2012 and 2016-2018; non-detects stored as 0 (2 of 16; detection limit (detection limit) up to 4.6 ng/g)
 Half-and-half cream
Nothing to watch: under the limit for a 15.3 g serving
More than anyone eatsNo realistic amount reaches the limit.Eating it daily comes to 107 g a week, which stays within the 180,000 g of room left before the limit.0.00438 µg per 15.3 g servingHealth Canada Total Diet Study, trace elements · grade A ?
How it’s rated
The counted figure is 180,000 g a week, about 1,670 servings a day.
A daily serving adds 0.024% to an average adult's cadmium intake (EFSA 2012 adult median, 1.77 µg/kg body weight/week; Canadian adults in 2007: 1.2-1.75), far from doubling it, so no cap.
Intake: one 15 mL serving, 70 kg adult (Health Canada TRA D.6) · Level in the food: 0.286 µg/kg (mean (equal-weight, 16 composites, two era rows combined), n = 16)
Measured on: Health Canada Total Diet Study trace elements, TDS food AA06 'Cream' (2000-2012, n = 13, 0 non-detects, mean 0.3122 ng/g) plus AA06 'Cream/Crème' (2016-2018, n = 3, 1 non-detect, mean 0.1708 ng/g), as consumed, ng/g = µg/kg; Canada. The TDS code states no fat percentage, so it is applied to both variants
- Heavy cream
Nothing to watch: under the limit for a 15.1 g serving
More than anyone eatsNo realistic amount reaches the limit.Eating it daily comes to 106 g a week, which stays within the 180,000 g of room left before the limit.0.00431 µg per 15.1 g servingHealth Canada Total Diet Study, trace elements · grade A ?
How it’s rated
The counted figure is 180,000 g a week, about 1,692 servings a day.
A daily serving adds 0.024% to an average adult's cadmium intake (EFSA 2012 adult median, 1.77 µg/kg body weight/week; Canadian adults in 2007: 1.2-1.75), far from doubling it, so no cap.
Intake: one 15 mL serving, 70 kg adult (Health Canada TRA D.6) · Level in the food: 0.286 µg/kg (mean (equal-weight, 16 composites, two era rows combined), n = 16)
Measured on: Health Canada Total Diet Study trace elements, TDS food AA06 'Cream' (2000-2012, n = 13, 0 non-detects, mean 0.3122 ng/g) plus AA06 'Cream/Crème' (2016-2018, n = 3, 1 non-detect, mean 0.1708 ng/g), as consumed, ng/g = µg/kg; Canada. The TDS code states no fat percentage, so it is applied to both variants
 Cottage cheese
Nothing to watch: under the limit for a 125 g serving
More than anyone eatsNo realistic amount reaches the limit.Eating it daily comes to 875 g a week, which stays within the 190,000 g of room left before the limit.0.034 µg per 125 g servingHealth Canada Total Diet Study, trace elements · grade A ?
How it’s rated
The counted figure is 190,000 g a week, about 217 servings a day.
A daily serving adds 0.19% to an average adult's cadmium intake (EFSA 2012 adult median, 1.77 µg/kg body weight/week; Canadian adults in 2007: 1.2-1.75), far from doubling it, so no cap.
Intake: one 125 g serving a day, 70 kg adult · Level in the food: 0.269 µg/kg (mean, n = 16)
Measured on: food-specific: HC TDS AA10 'Cheese, cottage (cottage Cheese 2%)', 16 composites 2000-2018 (2% cottage; the listing is creamed)
 Apple (Fuji), raw
Nothing to watch: under the limit for a 140 g serving
More than anyone eatsNo realistic amount reaches the limit.Eating it daily comes to 980 g a week, which stays within the 220,000 g of room left before the limit.0.033 µg per 140 g servingHealth Canada Total Diet Study, trace elements · grade A ?
How it’s rated
The counted figure is 220,000 g a week, about 222 servings a day.
A daily serving adds 0.19% to an average adult's cadmium intake (EFSA 2012 adult median, 1.77 µg/kg body weight/week; Canadian adults in 2007: 1.2-1.75), far from doubling it, so no cap.
Intake: one 140 g serving a day, 70 kg adult · Level in the food: 0.235 µg/kg (mean, n = 16)
Measured on: food-specific but generic apple: HC TDS HH03 'Apples (Cooked and raw apples)', 16 composites 2000-2018, six cities
 Kefir, low-fat
Nothing to watch: under the limit for a 193 g serving
More than anyone eatsNo realistic amount reaches the limit.Eating it daily comes to 1,352 g a week, which stays within the 230,000 g of room left before the limit.0.043 µg per 193 g servingHealth Canada Total Diet Study, trace elements · grade B ?
How it’s rated
The counted figure is 230,000 g a week, about 168 servings a day.
A daily serving adds 0.24% to an average adult's cadmium intake (EFSA 2012 adult median, 1.77 µg/kg body weight/week; Canadian adults in 2007: 1.2-1.75), far from doubling it, so no cap.
Intake: one 188 mL (193.1 g) serving a day, 70 kg adult · Level in the food: 0.224 µg/kg (mean, n = 16)
Measured on: category, NOT kefir-specific: HC TDS AA08 'Yogurt (fruit and plain)', 16 composites 2000-2018, no non-detect (the nearest fermented-dairy composite; no kefir composite exists, q=kefir returns 0 records)
1 other measurement of this food
- Health Canada TDS, 1% milk, kefir's base
Nothing to watch: under the limit
More than anyone eatsNo realistic amount reaches the limit.Eating it daily comes to 1,352 g a week, which stays within the 510,000 g of room left before the limit.0.019 µg per 193 g servingHealth Canada Total Diet Study, trace elements · grade B ?
How it’s rated
The counted figure is 510,000 g a week, about 380 servings a day.
A daily serving adds 0.11% to an average adult's cadmium intake (EFSA 2012 adult median, 1.77 µg/kg body weight/week; Canadian adults in 2007: 1.2-1.75), far from doubling it, so no cap.
Intake: one 188 mL (193.1 g) serving a day, 70 kg adult · Level in the food: 0.099 µg/kg (mean, n = 16)
Measured on: context: HC TDS AA03 'Milk, 1%', 16 composites 2000-2018, 2 non-detects (the base milk of a low-fat kefir)
 Plain yogurt, whole milk
Nothing to watch: under the limit for a 115 g serving
More than anyone eatsNo realistic amount reaches the limit.Eating it daily comes to 805 g a week, which stays within the 230,000 g of room left before the limit.0.026 µg per 115 g servingHealth Canada Total Diet Study, trace elements · grade A ?
How it’s rated
The counted figure is 230,000 g a week, about 283 servings a day.
A daily serving adds 0.15% to an average adult's cadmium intake (EFSA 2012 adult median, 1.77 µg/kg body weight/week; Canadian adults in 2007: 1.2-1.75), far from doubling it, so no cap.
Intake: one 115 g serving a day, 70 kg adult · Level in the food: 0.224 µg/kg (mean, n = 16)
Measured on: food-specific: HC TDS AA08 'Yogurt (fruit and plain)' (one composite per year, mixed fruit and plain yogurt; not plain-only)
 Greek yogurt, plain, nonfat
Nothing to watch: under the limit for a 115 g serving
More than anyone eatsNo realistic amount reaches the limit.Eating it daily comes to 805 g a week, which stays within the 230,000 g of room left before the limit.0.026 µg per 115 g servingHealth Canada Total Diet Study, trace elements · grade B ?
How it’s rated
The counted figure is 230,000 g a week, about 283 servings a day.
A daily serving adds 0.15% to an average adult's cadmium intake (EFSA 2012 adult median, 1.77 µg/kg body weight/week; Canadian adults in 2007: 1.2-1.75), far from doubling it, so no cap.
Intake: one 115 g serving a day, 70 kg adult · Level in the food: 0.224 µg/kg (mean, n = 16)
Measured on: food-specific: HC TDS AA08 'Yogurt (fruit and plain)' (one composite per year, mixed fruit and plain yogurt; not plain-only)
 Cola
Nothing to watch: under the limit for a 391 g serving
More than anyone eatsNo realistic amount reaches the limit.Eating it daily comes to 2,737 g a week, which stays within the 260,000 g of room left before the limit.0.076 µg per 391 g servingHealth Canada Total Diet Study, trace elements · grade B ?
How it’s rated
The counted figure is 260,000 g a week, about 96 servings a day.
A daily serving adds 0.41% to an average adult's cadmium intake (EFSA 2012 adult median, 1.77 µg/kg body weight/week; Canadian adults in 2007: 1.2-1.75), far from doubling it, so no cap.
Intake: one 375 mL reference amount (391.0 g at 1.0427 g/mL) a day, 70 kg adult · Level in the food: 0.195 µg/kg (mean (equal-weight, 16 composites), n = 16)
Measured on: Health Canada Total Diet Study trace elements, TDS code KK05 'Soft drinks, canned (Cola and lemon-lime (reg and diet))': ONE category composite covering regular AND diet cola and lemon-lime, so it is not cola-regular-specific (grade B). Composites 2000-2012 (n=13) and 2016-2018 (n=3), as consumed, equal-weight mean of all composites; non-detects stored as 0
 Diet cola
Nothing to watch: under the limit for a 375 g serving
More than anyone eatsNo realistic amount reaches the limit.Eating it daily comes to 2,628 g a week, which stays within the 260,000 g of room left before the limit.0.073 µg per 375 g servingHealth Canada Total Diet Study, trace elements · grade B ?
How it’s rated
The counted figure is 260,000 g a week, about 100 servings a day.
A daily serving adds 0.41% to an average adult's cadmium intake (EFSA 2012 adult median, 1.77 µg/kg body weight/week; Canadian adults in 2007: 1.2-1.75), far from doubling it, so no cap.
Intake: one 375 mL reference amount (375.4 g at 1.00101 g/mL) a day, 70 kg adult · Level in the food: 0.195 µg/kg (mean (equal-weight, 16 composites), n = 16)
Measured on: Health Canada Total Diet Study trace elements, TDS code KK05 'Soft drinks, canned (Cola and lemon-lime (reg and diet))': ONE category composite covering regular AND diet cola and lemon-lime, so it is not cola-regular-specific (grade B). Composites 2000-2012 (n=13) and 2016-2018 (n=3), as consumed, equal-weight mean of all composites; non-detects stored as 0
 Black tea, brewed
Nothing to watch: under the limit for a 250 g serving
More than anyone eatsNo realistic amount reaches the limit.Eating it daily comes to 1,750 g a week, which stays within the 300,000 g of room left before the limit.0.043 µg per 250 g servingHealth Canada Total Diet Study, trace elements · grade A ?
How it’s rated
The counted figure is 300,000 g a week, about 170 servings a day.
A daily serving adds 0.24% to an average adult's cadmium intake (EFSA 2012 adult median, 1.77 µg/kg body weight/week; Canadian adults in 2007: 1.2-1.75), far from doubling it, so no cap.
Intake: one 250 mL (250 g) cup a day, 70 kg adult · Level in the food: 0.172 ng/g (mean (equal-weight), n = 16)
Measured on: Canadian TDS (Health Canada, open.canada.ca dataset 83934503-cfae-4773-b258-e336896c2c53), item KK06 'Tea (Black tea)', Basis for Result 'As consumed', Intended Use 'Ready-to-eat', composites 1999 (average of 1993-99) and 2000-2012, 2016-2018, Canadian cities; the brewing recipe is not stated in the record; 16 composites 2000-2018 (4 non-detects, LODs 0.08-0.4); lower bound 0.148, upper bound 0.196; recent 2016-18 mean 0.073
 Coffee, brewed
Nothing to watch: under the limit for a 250 g serving
More than anyone eatsNo realistic amount reaches the limit.Eating it daily comes to 1,752 g a week, which stays within the 310,000 g of room left before the limit.0.042 µg per 250 g servingHealth Canada Total Diet Study, trace elements · grade A ?
How it’s rated
The counted figure is 310,000 g a week, about 175 servings a day.
A daily serving adds 0.24% to an average adult's cadmium intake (EFSA 2012 adult median, 1.77 µg/kg body weight/week; Canadian adults in 2007: 1.2-1.75), far from doubling it, so no cap.
Intake: one 250 mL cup (250.25 g) a day, 70 kg adult · Level in the food: 0.167 µg/kg (mean (equal-weight, 16 composites), n = 16)
Measured on: Health Canada Total Diet Study, trace elements, food 'Coffee, Roast & Ground', TDS code KK04 'Coffee (Instant and brewed coffee)', composites 2000-2018 (6 cities), Intended Use ready-to-eat, as consumed; 4 non-detects (detection limit (detection limit) 0.07-0.3) stored as 0
1 other measurement of this food
- US FDA TDS 2018-20, none detected in 3 samples
Nothing to watch: under the limit
No gram figure for this foodWe have no measurement of this in this food, so there is no gram figure.US FDA Total Diet Study (2018–2020) · grade A ?
How it’s rated
No cap: none of the 3 brewed-coffee samples had detectable cadmium (reporting limit 1 ppb), so no concentration can be given. Even if every sample sat at the reporting limit, it would take at least 175,000 g a week to reach the tolerable weekly intake. This agrees with Health Canada: cadmium in the brewed cup is at or below the detection limit.
Intake: one 250 mL cup (250.25 g) a day, 70 kg adult
Measured on: FDA Total Diet Study FY2018-2020, TDS #305 'Coffee, brewed from ground', 3 samples, reporting limit 1 ppb
 Cherries, raw
Nothing to watch: under the limit for a 140 g serving
More than anyone eatsNo realistic amount reaches the limit.Eating it daily comes to 980 g a week, which stays within the 310,000 g of room left before the limit.0.023 µg per 140 g servingCFIA chemical residue monitoring (2016–2023) · grade B ?
How it’s rated
The counted figure is 310,000 g a week, about 314 servings a day.
A daily serving adds 0.13% to an average adult's cadmium intake (EFSA 2012 adult median, 1.77 µg/kg body weight/week; Canadian adults in 2007: 1.2-1.75), far from doubling it, so no cap.
Intake: one 140 g serving a day (HC TRA J.1), 70 kg adult · Level in the food: 0.166 ng/g (lower-bound mean over all n, n = 108)
Measured on: CFIA NCRMP annexes B1 (domestic) and B2 (import), fresh cherry commodity 'Cherry', 2016-17 to 2022-23, Canada; n 108 and positives 4 pooled by the script; lower-bound mean over all n (non-detects as 0); targeted inspection, not a random survey
 Skim milk
Nothing to watch: under the limit for a 263 g serving
More than anyone eatsNo realistic amount reaches the limit.Eating it daily comes to 1,842 g a week, which stays within the 360,000 g of room left before the limit.0.037 µg per 263 g servingHealth Canada Total Diet Study, trace elements · grade A ?
How it’s rated
The counted figure is 360,000 g a week, about 195 servings a day.
A daily serving adds 0.21% to an average adult's cadmium intake (EFSA 2012 adult median, 1.77 µg/kg body weight/week; Canadian adults in 2007: 1.2-1.75), far from doubling it, so no cap.
Intake: one 250 mL serving a day (263.1 g, inherited), 70 kg adult (Health Canada TRA D.11) · Level in the food: 0.142 ng/g (µg/kg) (mean (equal-weight over composites, label eras pooled n-weighted), n = 15)
Measured on: Health Canada TDS AA04 'Milk, skim' (Food Name 'Milk, Skimmed'), As consumed, Canada: 15 composites (8 in 2000-2007, 4 in 2009-2012, 3 in 2016-2018), 3 non-detects stored as 0; queried from the open.canada.ca CKAN datastore (resource 9c988c19-07ae-4aa4-8496-84658b6b0c45)
- Milk, 2%
Nothing to watch: under the limit for a 263 g serving
More than anyone eatsNo realistic amount reaches the limit.Eating it daily comes to 1,842 g a week, which stays within the 510,000 g of room left before the limit.0.026 µg per 263 g servingHealth Canada Total Diet Study, trace elements · grade A ?
How it’s rated
The counted figure is 510,000 g a week, about 277 servings a day.
A daily serving adds 0.15% to an average adult's cadmium intake (EFSA 2012 adult median, 1.77 µg/kg body weight/week; Canadian adults in 2007: 1.2-1.75), far from doubling it, so no cap.
Intake: one 250 mL serving a day (263.1 g, inherited), 70 kg adult (Health Canada TRA D.11) · Level in the food: 0.1 ng/g (µg/kg) (mean (equal-weight over composites, label eras pooled n-weighted), n = 32)
Measured on: Health Canada TDS AA02 'Milk, 2%', As consumed, Canada: 26 composites 2000-2012 (mean 0.1016, 8 non-detects, detection limit (detection limit) 0-0.09) + 6 composites 2016-2018 (mean 0.09359, 0 non-detects); non-detects stored as 0
 Walnuts, raw
Nothing to watch: under the limit for a 30 g serving
More than anyone eatsNo realistic amount reaches the limit.Eating it daily comes to 210 g a week, which stays within the 540,000 g of room left before the limit.0.00285 µg per 30 g servingUS FDA Total Diet Study (2018–2020) · grade A ?
How it’s rated
The counted figure is 540,000 g a week, about 2,561 servings a day.
A daily serving adds 0.016% to an average adult's cadmium intake (EFSA 2012 adult median, 1.77 µg/kg body weight/week; Canadian adults in 2007: 1.2-1.75), far from doubling it, so no cap.
Intake: 30 g shelled serving (HC TRA O.1) · Level in the food: 0.095 µg/kg (mean (nondetects counted as zero); 2 of 22 samples detected, max 1.1 ppb, n = 22)
Measured on: US FDA Total Diet Study FY2018-2020, TDS food 403 Walnuts, shelled; 22 samples; reporting limit 1 ppb; USA
 Green tea, brewed
Nothing to watch: under the limit for a 250 g serving
More than anyone eatsNo realistic amount reaches the limit.Eating it daily comes to 1,750 g a week, which stays within the 610,000 g of room left before the limit.0.021 µg per 250 g servingHow it’s rated
The counted figure is 610,000 g a week, about 351 servings a day.
A daily serving adds 0.12% to an average adult's cadmium intake (EFSA 2012 adult median, 1.77 µg/kg body weight/week; Canadian adults in 2007: 1.2-1.75), far from doubling it, so no cap.
Intake: one 250 mL (250 g) cup a day, 70 kg adult · Level in the food: 0.083 µg/L (derived mean: CFIA dry-leaf mean (0.04952 µg/g, n = 100) x 10 g leaf per litre x orthodox-green-tea transfer rate 16.82%, n = 100)
Measured on: DERIVED, not measured in a cup. Leaf: CFIA dried teas 2009-10, Canada, n = 100 (Cd detected 100/100; mean 0.04952, median 0.0479, max 0.2004 µg/g DRY LEAF; tea type not stated). Transfer: Deka 2021, orthodox green tea, average Cd extraction 16.82% (CTC 18.13%). Brew ratio 10 g/L (Pavlovic method). 1 µg/L = 0.001 µg/g.
 Tilapia, cooked
Nothing to watch: under the limit for a 100 g serving
More than anyone eatsNo realistic amount reaches the limit.Eating it daily comes to 700 g a week, which stays within the 910,000 g of room left before the limit.0.0056 µg per 100 g servingUS FDA Total Diet Study (2018–2020) · grade A ?
How it’s rated
The counted figure is 910,000 g a week, about 1,304 servings a day.
A daily serving adds 0.032% to an average adult's cadmium intake (EFSA 2012 adult median, 1.77 µg/kg body weight/week; Canadian adults in 2007: 1.2-1.75), far from doubling it, so no cap.
Intake: 100 g cooked (HC TRA I.3), one serving a day · Level in the food: 0.056 ppb (mean (1 detect in 27), n = 27)
Measured on: FDA Total Diet Study FY2018-FY2020, TDS food 388 "Tilapia, baked" (as eaten, baked; US retail; 27 samples). 26 of 27 non-detects, reporting limit 1 ppb, max 1.5 ppb; the sheet does not say how non-detects enter the mean (a lower bound is assumed; with non-detects at the reporting limit the mean would be about 0.96 ppb).
 Quinoa, dry
Nothing to watch: under the limit for a 45 g serving
No gram figure for this foodThe measurement is in a unit that can’t be compared with the limit, so there is no gram figure.Bielecka 2022 · grade B ?
How it’s rated
A daily serving adds 7% to an average adult's cadmium intake (EFSA 2012 adult median, 1.77 µg/kg body weight/week; Canadian adults in 2007: 1.2-1.75), far from doubling it, so no cap.
Intake: one 45 g dry serving a day, 70 kg adult · Level in the food: 27.53 µg/kg dry grain (mean, n = 30)
Measured on: single retail survey, dry grain as purchased, Poland 2021 (grade B: one country, no cooking, no agency)
 Olive oil, extra virgin
Nothing to watch: under the limit for a 9.1 g serving
No gram figure for this foodIt was below what the test can detect, so there is no gram figure.US FDA Total Diet Study (2018–2020) · grade A ?
How it’s rated
A daily serving adds 0.1% to an average adult's cadmium intake (EFSA 2012 adult median, 1.77 µg/kg body weight/week; Canadian adults in 2007: 1.2-1.75), far from doubling it, so no cap.
Intake: one 9.07 g (10 mL) serving a day, 70 kg adult · Level in the food: 0 micrograms/kg (mean, n = 3)
Measured on: food-specific: FDA TDS FY2018-20 #378 'Oil, olive', 3 composites, 0 detects, reporting limit 2 ppb. NO Canadian TDS composite: the Health Canada TDS cadmium records have no olive item (a text search for 'olive' returned 0; II01 'Cooking fats and salad oils' = lard, shortening, canola, corn)
 Cream cheese
Nothing to watch: under the limit for a 30 g serving
No gram figure for this foodWe have no measurement of this in this food, so there is no gram figure.US FDA Total Diet Study (2018–2020) · grade A ?
How it’s rated
No cap: EFSA's tolerable weekly intake for cadmium is 2.5 µg/kg body weight/week, 175 µg a week. All 3 FDA composites were non-detects, so no mean can be computed; if every composite sat at the 1 ppb reporting limit, 175,000 g a week would reach it, so the true figure is at least that (a floor).
Intake: one 30 g serving a day (HC TRA D.1), 70 kg adult
Measured on: US FDA Total Diet Study FY2018-2020 elements supplement, TDS food 237 'Cream cheese' (as eaten, US), reporting limit 1 ppb
1 other measurement of this food
- Health Canada TDS, cream standing in for cream cheese
Nothing to watch: under the limit
More than anyone eatsNo realistic amount reaches the limit.Eating it daily comes to 210 g a week, which stays within the 180,000 g of room left before the limit.0.0086 µg per 30 g servingHealth Canada Total Diet Study, trace elements · grade B ?
How it’s rated
The counted figure is 180,000 g a week, about 852 servings a day.
A daily serving adds 0.048% to an average adult's cadmium intake (EFSA 2012 adult median, 1.77 µg/kg body weight/week; Canadian adults in 2007: 1.2-1.75), far from doubling it, so no cap.
Intake: one 30 g serving a day (HC TRA D.1), 70 kg adult · Level in the food: 0.286 µg/kg (mean (equal-weight, 16 composites: 13 composites 2000-2012 at 0.3122 and 3 composites 2016-2018 at 0.1708), n = 16)
Measured on: PROXY: Health Canada Total Diet Study, TDS food AA06 'Cream' (cream; not cream cheese), as consumed, Canada, 2000-2012 and 2016-2018; non-detects stored as 0
 Sour cream
Nothing to watch: under the limit for a 29 g serving
No gram figure for this foodWe have no measurement of this in this food, so there is no gram figure.US FDA Total Diet Study (2018–2020) · grade A ?
How it’s rated
No cap: EFSA's tolerable weekly intake (TWI) for cadmium is 2.5 µg/kg body weight/week, 175 µg a week for 70 kg. All 3 FDA composites were non-detect at the 1 ppb reporting limit, so no mean can be computed. Even if every composite sat at that limit (0.001 µg/g), 175,000 g a week would be needed to reach it, so the grams figure is at least 175,000 g: a floor, not an estimate.
Intake: one 29 g serving a day (HC TRA D.14), 70 kg adult
Measured on: US FDA Total Diet Study FY2018-2020 elements supplement, TDS food 300 'Sour cream' (as eaten, US), reporting limit 1 ppb
1 other measurement of this food
- Health Canada TDS, cream standing in for sour cream
Nothing to watch: under the limit
More than anyone eatsNo realistic amount reaches the limit.Eating it daily comes to 204 g a week, which stays within the 180,000 g of room left before the limit.0.0083 µg per 29 g servingHealth Canada Total Diet Study, trace elements · grade B ?
How it’s rated
The counted figure is 180,000 g a week, about 875 servings a day.
A daily serving adds 0.047% to an average adult's cadmium intake (EFSA 2012 adult median, 1.77 µg/kg body weight/week; Canadian adults in 2007: 1.2-1.75), far from doubling it, so no cap.
Intake: one 29 g serving a day (HC TRA D.14), 70 kg adult · Level in the food: 0.286 µg/kg (mean (equal-weight, 16 composites, two era rows combined: 13 composites 2000-2012 at 0.3122 and 3 composites 2016-2018 at 0.1708), n = 16)
Measured on: PROXY: Health Canada Total Diet Study, TDS food AA06 'Cream' (cream; not sour cream), as consumed, Canada, 2000-2012 and 2016-2018; non-detects stored as 0
 Chicken liver, simmered
Not rated yet for a 100 g serving
No gram figure for this foodWe have no measurement of this in this food, so there is no gram figure.Health Canada Total Diet Study, trace elements · grade B ?
How it’s rated
Missing, not rated. Health Canada's TDS has only CC03 'Poultry, liver pate' (cadmium 10.83 ng/g, 12 composites, 2000-2012; 17.04 ng/g, 3 composites, 2016-2018), a spread of unstated liver content, so it is not a chicken liver concentration. Beef liver is 34 ng/g in the same TDS.
Intake: not applicable (flag)
Measured on: no Canadian, FDA, EFSA or Hong Kong total diet food code for chicken liver
 Edamame, cooked
Not rated yet for a 85 g serving
No gram figure for this foodWe have no measurement of this in this food, so there is no gram figure.CFIA 2016–2017 · grade C ?
How it’s rated
Not rated: EFSA's 2009 tolerable weekly intake for cadmium is 175 µg/week for 70 kg, but no measurement of edamame (green soybean, frozen or cooked) was found. Dry mature soybeans measured 3.7–11 µg/kg in CFIA samples, a different stage, and cooked mature soybeans (20.5 µg/kg) are not used as a proxy, so the as-eaten amount is left missing.
Intake: one 85 g serving a day, 70 kg adult
Measured on: No measurement of edamame (green soybean, frozen or cooked) found in Health Canada TDS, CFIA annexes, FDA TDS (not searched) or the literature searched (search 1)
 Lemon juice
Not rated yet for a 5.2 g serving
No gram figure for this foodWe have no measurement of this in this food, so there is no gram figure.CFIA chemical residue monitoring (2016–2023) · grade B ?
How it’s rated
Not rated: EFSA's 2009 tolerable weekly intake for cadmium is 2.5 µg/kg body weight/week, 175 µg a week for 70 kg. There is no as-eaten concentration for lemon juice: the nearest CFIA figures are for the whole fruit (peel included) or the concentrate, and converting needs a dilution factor that was not found. On the whole-fruit basis only, even at CFIA's highest lemon value (0.0063 µg/g), about 27,800 g a week would reach the limit, so no cap is likely at a 5.0 g serving, but that is not a row figure.
Intake: 5 mL (5.2 g) a day
Measured on: No Health Canada TDS food code names lemon juice or lime juice (term searches return only lemon meringue pie and lemon-lime soft drinks). CFIA has one juice sample (n 1, import 2016-17, not detected) and a 2008-09 concentrate survey with no cadmium line.
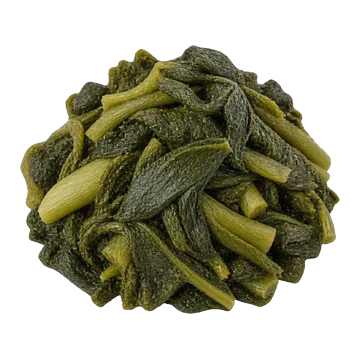 Mustard greens, cooked
Not rated yet for a 85 g serving
No gram figure for this foodWe have no measurement of this in this food, so there is no gram figure.Health Canada Total Diet Study, trace elements
How it’s rated
Cannot be rated: no food-specific or category occurrence value for mustard greens in the sources opened. Not borrowed from collards.
Intake: one 85 g serving a day, 70 kg adult
Measured on: no mustard-greens data in Health Canada TDS, FDA TDS FY2018-2020 or CFIA 2018-19 metals (3 resources); EFSA 2012 blocked
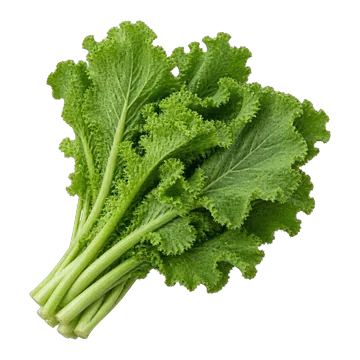 Mustard greens, raw
Not rated yet for a 85 g serving
No gram figure for this foodWe have no measurement of this in this food, so there is no gram figure.Health Canada Total Diet Study, trace elements
How it’s rated
Cannot be rated: no food-specific or category occurrence value for mustard greens in the sources opened. Not borrowed from collards.
Intake: one 85 g serving a day, 70 kg adult
Measured on: no mustard-greens data in Health Canada TDS, FDA TDS FY2018-2020 or CFIA 2018-19 metals (3 resources); EFSA 2012 blocked
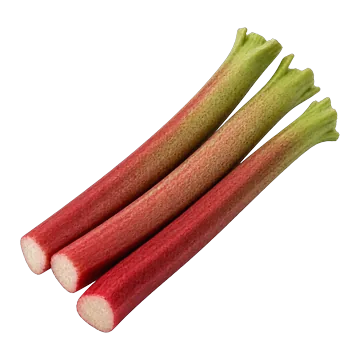 Rhubarb, raw
Not rated yet for a 140 g serving
No gram figure for this foodWe have no measurement of this in this food, so there is no gram figure.Health Canada Total Diet Study, trace elements
How it’s rated
Not rated: no measured cadmium value for rhubarb has been found yet. None is borrowed from celery, spinach, a fruit or a food category.
Intake: one 140 g serving a day (85 g is the alternative), 70 kg adult
Measured on: Not found: no rhubarb-specific agency occurrence. Health Canada TDS trace elements (resource 9c988c19..., Cadmium): q=rhubarb returned 0 records. FDA TDS FY2018-2020 workbook: no rhubarb row. EFSA 2009/2012 category tables: Wiley reader 403, blocked.
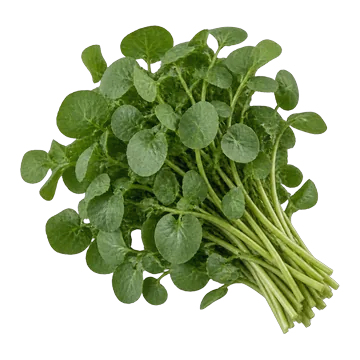 Watercress, raw
Not rated yet for a 85 g serving
No gram figure for this foodWe have no measurement of this in this food, so there is no gram figure.Health Canada Total Diet Study, trace elements
How it’s rated
Not rated: no measured cadmium value for watercress has been found yet. None is borrowed from lettuce, spinach or a food category.
Intake: one 85 g serving a day, 70 kg adult
Measured on: Not found: no watercress-specific agency occurrence found. Health Canada TDS datastore (resource 9c988c19..., Cadmium): q=watercress and q=cress returned 0 records. FDA TDS FY2018-2020 workbook: no cress or arugula row. EFSA 2009/2012 category tables: Wiley reader 403, blocked.
Sources
- Bielecka J, Puscion-Jakubik A, Markiewicz-Zukowska R, et al. Assessment of the Safe Consumption of Nuts in Terms of the Content of Toxic Elements with Chemometric Analysis. Nutrients 2021;13(10):3606 · doi:10.3390/nu13103606 · PMID 34684607
bielecka-2021-nuts-toxic-elements· secondary source · CC BY 4.0 - Bielecka J, Markiewicz-Żukowska R, Puścion-Jakubik A, Grabia M, et al. Gluten-free cereals and pseudocereals as a potential source of exposure to toxic elements among Polish residents. Nutrients 2022;14(11):2342 · doi:10.3390/nu14112342 · PMID 35684142
bielecka2022· full text read · CC BY 4.0 - CFIA. Pesticides and Metals in Selected Foods, April 1, 2018 to March 31, 2019 (open.canada.ca dataset e4194282-102a-40ec-ac4c-0ce20e9a33cf, resource 35516ebc-f2f1-4e4b-9843-f57e8fa36ce6, product 'Seed - Flax', 8 samples)
cfia-2018-19-pesticides-metals· secondary source · Open Government Licence - Canada - CFIA, Mercury and Metals in Fish Products 2000-2021 (tuna rows: 7,072; canned 2,388)
cfia-fish-metals-2000-2021· dataset · Open Government Licence – Canada 2.0 - CFIA, Pesticides and Metals in Selected Foods, April 1, 2018 to March 31, 2019 (targeted survey report; Table 3, nut/seed products n = 470)
cfia-metals-2018-2019· page · Government of Canada terms (not checked; Open Government Licence not confirmed for the report page) - CFIA, Mercury and Metals in Fish Products, 2000-2021 (inspection results; compilation of raw data)
cfia-metals-fish-2000-2021· dataset · Open Government Licence – Canada 2.0 - CFIA, National Chemical Residue Monitoring Program and Chemistry Food Safety Oversight Program Annual Report 2022-2023, Annex B tables B-1 (Canadian) and B-2 (imported)
cfia-ncrmp-2022-23· full text read · Open Government Licence - Canada - CFIA, National Chemical Residue Monitoring Program, Annex B results summaries 2016-17 to 2022-23, Table B-1 domestic and B-2 imported (open.canada.ca datasets 95a14ca0, c87af563, a2ea8989, 9e5211c8, a5cb7c3c, 6567ac46, cf149850); positives-only means, no detection limits stated; pooled by us
cfia-ncrmp-annex-b-2016-2023· dataset · Government of Canada terms (Crown copyright) - CFIA, National Chemical Residue Monitoring Program, Annex B1 (domestic) and B2 (import) results summaries 2016-17 to 2022-23 (open.canada.ca); rows Watermelon, Melon - Cantaloupe, Cucumber, Zucchini
cfia-ncrmp-annexes-2016-2023· secondary source · Government of Canada terms (Crown copyright) - CFIA, Pesticides and Metals in Grain Products and Ready-to-Eat Meals, April 1, 2016 to March 31, 2017
cfia-pesticides-metals-2016-2017· dataset · Open Government Licence - Canada - CFIA, Toxic Metals in Selected Foods, April 1, 2018 to March 31, 2019 (open data resource 0e040e20-f157-46ce-860b-186b294ce1f7, product 'Protein Powder', 3,724 rows = 196 samples x 19 analytes)
cfia-toxic-metals-2018-19· dataset · Open Government Licence - Canada - Deka H, Barman T, Sarmah PP, Devi A, Tamuly P, Karak T. Impact of processing method on selected trace elements content of green tea: Does CTC green tea infusion possess risk towards human health? Food Chem X 2021;12:100173 · doi:10.1016/j.fochx.2021.100173 · PMID 34917927
deka2021· secondary source · CC BY 4.0 - EFSA CONTAM Panel (2009) Cadmium in food. EFSA Journal 980 · doi:10.2903/j.efsa.2009.980
efsa-2009-cadmium· full text read · EFSA Journal: CC BY-ND 4.0 - EFSA (2012) Cadmium dietary exposure in the European population. EFSA Journal 10(1):2551 · doi:10.2903/j.efsa.2012.2551
efsa-2012-cadmium-exposure· full text read · EFSA Journal: CC BY-ND 4.0 - US FDA. Total Diet Study elements FY2018-FY2020 summary (media159749).
fda-tds-elements-fy2018-2020· dataset · US public domain - US FDA, Total Diet Study FY2018–FY2020 Elements Report Supplement
fda-tds-fy2018-2020· dataset · US government work (17 USC 105), public domain - Hands JM, Anderson ML, Cooperman T, Balsky JE, Frame LA (2024) A multi-year heavy metal analysis of 72 dark chocolate and cocoa products in the USA. Front Nutr 11:1366231 · doi:10.3389/fnut.2024.1366231 · PMID 39144282
hands-2024-cocoa-metals· full text read · CC BY 4.0 - Health Canada, Canadian Total Diet Study – Trace Elements (2005–2018 composites)
hc-tds-trace-elements· dataset · Open Government Licence – Canada 2.0 - Health Canada. Total Diet Study trace elements, open.canada.ca dataset 83934503, English resource 9c988c19-07ae-4aa4-8496-84658b6b0c45; composites pooled as an equal-weight mean per TDS food code, non-detects stored as 0.
hc-tds-trace-elements-open-canada· secondary source · Open Government Licence - Canada - Kollander B, Rodushkin I, Sundström B. Multi-Element Assessment of Potentially Toxic and Essential Elements in New and Traditional Food Varieties in Sweden. Foods 2023;12:1831 · doi:10.3390/foods12091831 · PMID 37174369
pmcid:PMC10178162· full text read · CC BY 4.0 - Rusin M, Domagalska J, Rogala D et al. Concentration of cadmium and lead in vegetables and fruits. Sci Rep 2021 · doi:10.1038/s41598-021-91554-z · PMID 34099845
pmid:34099845· secondary source · CC BY (Europe PMC licence field, PMC8184968) - El Youssfi M et al. Monitoring and Health Risk Assessment of Lead and Cadmium in Date Palm Fruit Cultivars Growing in Morocco. Biol Trace Elem Res 2025 · doi:10.1007/s12011-024-04242-0 · PMID 38776020
pmid:38776020· abstract only · licence not recorded - Redan BW, Zuklic J, Hryshko J, Boyer M, Wan J, Sandhu A, Jackson LS. Analysis of eight types of plant-based milk alternatives from the United States market for target minerals and trace elements. J Food Compos Anal 2023;122:105457 · doi:10.1016/j.jfca.2023.105457
redan2023-plant-milk-elements· full text read · licence not recorded - Nesic A, Lucic M, Veskovic J, Mandic L, Jankovic Momcilovic M, Miletic A, Onjia A (2024) Impact of Chocolate Cadmium on Vulnerable Populations in Serbia. Foods 14(1):18 · doi:10.3390/foods14010018 · PMID 39796308
serbia-2024-chocolate-cd· full text read · CC BY 4.0