Dioxins and dioxin-like PCBs
Long-lasting pollutants that build up in animal fat: fish, meat, eggs and dairy carry most of them.
In the body: They build up in body fat and stay for years. The limit protects sons from lower sperm counts later in life, after exposure in the womb and through breast milk.
An average adult already takes in 3 to 9 times the weekly limit from food as a whole, so no one food is rated against it. 29 reviewed foods carry it, among them canned sardines, canned light tuna and raw mackerel.
What you can do: Dioxins collect mainly in animal fat. WHO says trimming the fat from meat and choosing lower-fat dairy may lower how much you take in, and a balanced diet helps avoid too much from any one source, though what one person can change is limited.
Builds up over time. Agencies set an amount you can take in every week, or every day, for life. A food measured against it shows the grams that reach it.
The limit
- The agency’s figure0.6 pg WHO 2022 toxic equivalents/kg body weight/week
- For a 70 kg adult42 pg WHO 2022 toxic equivalents a week
- Basistolerable weekly intake (TWI): what you can take in every week for life
tolerable weekly intake (TWI) (PCDD/Fs + dl-PCBs) - Average adult intake1.87–5.64 pg WHO 2022 toxic equivalents/kg body weight/week EFSA 2026 adults, minimum lower bound to maximum upper bound; the abstract's 6.10 is the very elderly maximum
- Source ?EFSA 2026
Reviewed foods that carry it
29 reviewed foods carry it; none is rated against the limit, because an average adult’s intake is already past it. A food counts once, as in the foods list: preparations sharing a page (raw and cooked, canned) count once; one with its own page counts apart. Below, one line for each of 34 preparations. 55 measurements in all. A preparation measured more than once gets one line, the measurement the dataset leads with or a stricter one, named beside the food; the others fold under it.
Grams to the limit ?
What one serving of each food comes to, as a share of the weekly limit for a 70 kg adult, on top of what food as a whole already brings. The grams that would reach the limit, eaten alone, are only for scale: the limit is already used up, so no food is singled out.
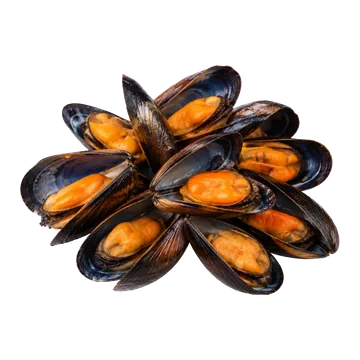 Mussels, cooked
Worth knowing for a 100 g serving
96%of the weekly limit in one 100 g serving, on top of what food already bringsFor scale: 100 g a week, eaten alone, would reach it.An average adult’s intake is already at or past this limit before this food, so there is no room left to count grams against.40.2 pg (d’équivalents toxiques) per 100 g servingCFIA dioxins survey (2014–2019) · grade C ?
How it’s rated
Flagged for dioxins and PCBs (small sample): EFSA's 2026 tolerable weekly intake is 0.6 pg WHO 2022 toxic equivalents/kg body weight/week, 42 pg/week for 70 kg. CFIA's 6 mussel samples average 0.4019 pg/g cooked on the upper bound, so about 105 g cooked a week, eaten alone, would reach it (273 g on the lower bound), and a 100 g serving carries 40.2 pg. The upper bound is mostly detection-limit contribution, one extreme sample drives the lower bound, and EFSA's mean adult intake is already above the weekly limit.
Intake: 100 g cooked (HC TRA I.3), one serving a day · Level in the food: 0.402 pg WHO 2022 toxic equivalents/g (mean, WHO 2022 toxic equivalents recomputed from congeners (as-sold upper bound mean 0.2009 x 2.00), n = 6)
Measured on: CFIA targeted survey 2014-2019, product "Mussel", 6 samples (China 5, Canada 1; 2017-2018), Percent Fat column 3.0 to 27.0 (median 21.7; as given, looks like a lipid-basis figure). Preparation not stated (as sold). WHO2022 recomputed: lower bound mean 0.0769, upper bound mean 0.2009 pg/g as sold; WHO2005 from the same rows lower bound 0.1184, upper bound 0.2725. Cooked-basis = upper bound x 2.00 water-loss factor (an upper bound).
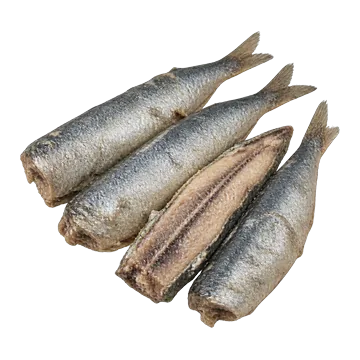 Sardines, canned in oil
Worth knowing for a 55 g serving
46%of the weekly limit in one 55 g serving, on top of what food already bringsFor scale: 120 g a week, eaten alone, would reach it.An average adult’s intake is already at or past this limit before this food, so there is no room left to count grams against.19.3 pg (WHO 2022 toxic equivalents, recomputed lower bound mean 0.351 x 55 g) per 55 g servingCFIA dioxins survey (2014–2019) · grade A ?
How it’s rated
Flagged for pregnancy, planning a pregnancy and breastfeeding; no cap for other adults. One serving a week is 46% (lower bound; upper bound 57%) of EFSA's 2026 tolerable weekly intake, 0.6 pg WHO 2022 toxic equivalents/kg body weight/week, on Foodtopsy's recalculation of the CFIA results with the 2022 toxic equivalency factors. On CFIA's published 2005 basis, a daily serving is 174% (lower bound) to 199% (upper bound) of EFSA's 2018 tolerable weekly intake of 2 pg/kg body weight/week, and 22% of the JECFA and Health Canada value of 2.3 pg/kg body weight/day. On the 2022 recalculation a daily serving would add 34% to 103% to EFSA's adult average intake of 1.87-5.64 pg/kg body weight/week (the lowest lower-bound to the highest upper-bound adult mean): it would double average intake only at the bottom of that range.
Intake: one 55 g serving a day, 70 kg adult · Level in the food: 0.633 pg WHO 2005 toxic equivalents/g (wet weight) (mean, n = 8)
Measured on: food-specific: CFIA targeted survey 2014-2019, 'Sardines', 8 samples (7 distinct: Malaysia and Scotland records identical). Published lower bound mean 0.633, upper bound mean 0.723 (n=8); 0.679 / 0.766 (n=7). Median lower bound 0.307; max 3.114 (Poland, canned per report). Product form per sample not stated
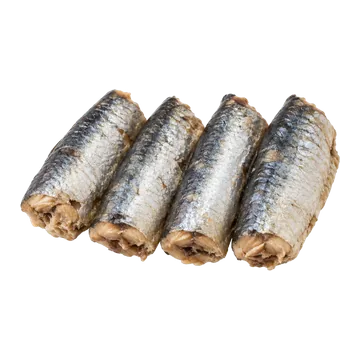 Sardines, canned in water
Worth knowing for a 55 g serving
46%of the weekly limit in one 55 g serving, on top of what food already bringsFor scale: 120 g a week, eaten alone, would reach it.An average adult’s intake is already at or past this limit before this food, so there is no room left to count grams against.19.3 pg (WHO 2022 toxic equivalents, lower bound mean x 55 g) per 55 g servingCFIA dioxins survey (2014–2019) · grade B ?
How it’s rated
Flagged for pregnancy, planning a pregnancy and breastfeeding; no cap for other adults. EFSA's 2026 tolerable weekly intake (TWI) for dioxins and dioxin-like compounds is 0.6 pg WHO 2022 toxic equivalents/kg body weight/week, 42 pg for 70 kg. On Foodtopsy's recalculation of the CFIA results (8 samples) with the 2022 toxic equivalency factors, the lower-bound mean is 0.351 pg/g, one serving a week is 46% of the limit (57% at the upper bound), and about 120 g a week eaten alone, roughly 2 cans of 55 g, would reach it. On CFIA's published 2005 basis, a daily serving is 174% (lower bound) to 199% (upper bound) of EFSA's 2018 TWI of 2 pg/kg body weight/week, and 22% of the JECFA and Health Canada value of 2.3 pg/kg body weight/day. A daily serving would add 34% to 103% to EFSA's adult average intake of 1.87-5.64 pg/kg body weight/week (the lowest lower-bound to the highest upper-bound adult mean); it would double average intake only at the bottom of that range.
Intake: one 55 g serving a day, 70 kg adult · Level in the food: 0.351 pg WHO 2022 toxic equivalents/g (mean (lower bound 0.351, upper bound 0.433), recomputed with WHO 2022 TEFs; CFIA published WHO2005 lower bound 0.633 / upper bound 0.723, n = 8)
Measured on: food-specific: CFIA targeted survey 2014-2019, 'Sardines', 8 samples (7 distinct: Malaysia and Scotland records identical). Published lower bound mean 0.633, upper bound mean 0.723 (n=8); 0.679 / 0.766 (n=7). Median lower bound 0.307; max 3.114 (Poland, canned per report). Product form per sample not stated
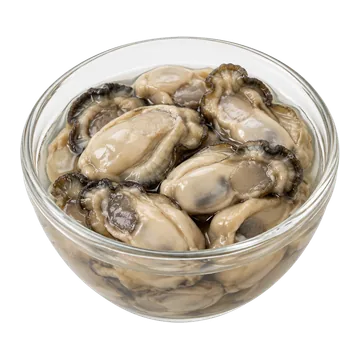 Oysters, canned
Worth knowing for a 55 g serving
41%of the weekly limit in one 55 g serving, on top of what food already bringsFor scale: 130 g a week, eaten alone, would reach it.An average adult’s intake is already at or past this limit before this food, so there is no room left to count grams against.17.3 pg (WHO 2022 toxic equivalents, upper bound) per 55 g servingCFIA dioxins survey (2014–2019) · grade B ?
How it’s rated
Flagged: EFSA's 2026 tolerable weekly intake for dioxins and dioxin-like PCBs is 0.6 pg WHO 2022 toxic equivalents/kg body weight/week, 42 pg a week. Eaten alone, about 133 g a week would reach it at the upper bound (0.3147 pg/g) and 309 g at the lower bound (0.136). The average adult's intake (18.7–56.4 pg a day) is already above the limit, and a 55 g serving adds 13% (lower bound over the highest background) to 93% (upper bound over the lowest). The data are 4 imported oyster samples from 2017 (CFIA); the form, canned or raw, is not stated, so this is a category figure, not a canned-oyster measurement.
Intake: 55 g canned (HC TRA I.4), one serving a day · Level in the food: 0.315 pg WHO 2022 toxic equivalents/g (mean, n = 4)
Measured on: CFIA targeted survey 2014-2019, product 'Oyster' (4 import samples, 2017, Korea 3, China 1). THE FORM IS NOT STATED (the file has no canned or raw field), so this is a category figure carried over from the raw-oyster file, not a canned-oyster measurement. WHO 2022 value recomputed by us from congeners (file totals are WHO 2005: mean lower bound 0.227, upper bound 0.445; our own WHO 2005 recomputation gives 0.232 and 0.453).
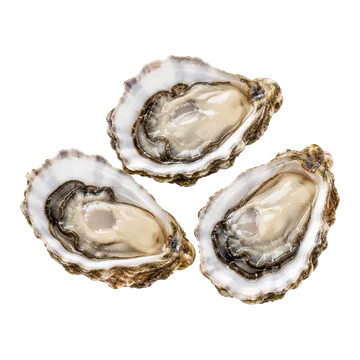 Eastern oysters, raw
Worth knowing for a 125 g serving
94%of the weekly limit in one 125 g serving, on top of what food already bringsFor scale: 130 g a week, eaten alone, would reach it.An average adult’s intake is already at or past this limit before this food, so there is no room left to count grams against.39.3 pg (WHO 2022 toxic equivalents, upper bound) per 125 g servingCFIA dioxins survey (2014–2019) · grade B ?
How it’s rated
Flagged: EFSA's 2026 tolerable weekly intake for dioxins and dioxin-like PCBs is 0.6 pg WHO 2022 toxic equivalents/kg body weight/week, 42 pg a week for 70 kg. Eaten alone, about 133 g a week would reach it at the upper bound (0.3147 pg/g) and 309 g at the lower bound (0.136). Mean adult intake of 1.87–5.64 pg/kg body weight/week (18.7–56.4 pg a day) is already above the limit; one daily serving adds 30% (lower bound over the highest background) to 210% (upper bound over the lowest). The data are 4 imported samples from 2017 (Korea 3, China 1), not necessarily the oysters sold in Canada.
Intake: 125 g raw (HC TRA I.3), one serving a day · Level in the food: 0.315 pg WHO 2022 toxic equivalents/g (mean, n = 4)
Measured on: CFIA targeted survey 2014-2019, product 'Oyster', 4 import samples from 2017 (Korea 3, China 1), fat 1.9 to 24.2% (as sold, pg/g sample). The file's own totals are WHO 2005 (mean lower bound 0.227, upper bound 0.445 pg toxic equivalents/g; our own WHO 2005 recomputation gives 0.232 and 0.453); the WHO 2022 figure is our recomputation from the 29 congener rows with the 2022 TEFs: mean lower bound 0.136, upper bound 0.315. Preparation not stated.
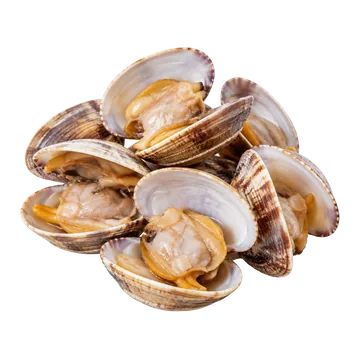 Clams, cooked
Worth knowing for a 100 g serving
50%of the weekly limit in one 100 g serving, on top of what food already bringsFor scale: 200 g a week, eaten alone, would reach it.An average adult’s intake is already at or past this limit before this food, so there is no room left to count grams against.20.8 pg (d’équivalents toxiques) per 100 g servingCFIA dioxins survey (2014–2019) · grade C ?
How it’s rated
Flagged for dioxins and PCBs: EFSA's 2026 tolerable weekly intake is 0.6 pg WHO 2022 toxic equivalents/kg body weight/week, 42 pg/week for 70 kg. From 7 CFIA samples (preparation not stated), the cooked-basis upper-bound mean is 0.2083 pg/g, so about 202 g cooked a week would reach it (1,038 g on the lower bound, 0.0234 × 1.73), and a 100 g cooked serving carries 20.8 pg. The upper bound is mostly detection-limit contribution: only 2 of the 7 samples had a lower-bound level above 0.01 pg/g.
Intake: 100 g cooked (HC TRA I.3), one serving a day · Level in the food: 0.208 pg WHO 2022 toxic equivalents/g (mean, WHO 2022 toxic equivalents recomputed from congeners (as-sold upper bound mean 0.1204 x 1.73), n = 7)
Measured on: CFIA targeted survey 2014-2019, product "Clam", 7 samples (China 3, Indonesia 3, Canada 1; 2017-2018), Percent Fat 0.16 to 2.3 (median 0.55). Preparation not stated (as sold). WHO2022 recomputed: lower bound mean 0.0234, upper bound mean 0.1204 pg/g as sold; WHO2005 from the same rows lower bound 0.0359, upper bound 0.1507. Cooked-basis = upper bound x 1.73 (an upper bound).
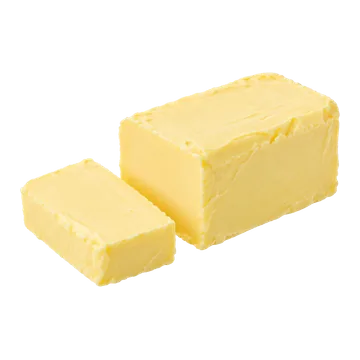 Butter, salted
Worth knowing for a 10 g serving
4%of the weekly limit in one 10 g serving, on top of what food already bringsFor scale: 230 g a week, eaten alone, would reach it.An average adult’s intake is already at or past this limit before this food, so there is no room left to count grams against.1.822 pg (WHO 2022 toxic equivalents) per 10 g servingCFIA dioxins survey (2014–2019) · grade A ?
How it’s rated
Flagged for women who are or may become pregnant and for breastfeeding women; no cap for other adults. EFSA's 2026 tolerable weekly intake for dioxins and PCBs is 0.6 pg/kg body weight/week, 42 pg for 70 kg. On the upper-bound mean of CFIA's 89 Canadian butter samples (0.1822 pg/g, non-detects counted at the detection limit), about 230.5 g of butter a week eaten alone would reach it, roughly 33 g a day. A daily 10 g serving is 30.4% of the weekly limit and adds 3.2% to 9.6% to the average adult's weekly exposure, far from doubling it.
Intake: one 10.0 g serving, 70 kg adult (Health Canada TRA H.1) · Level in the food: 0.182 pg WHO 2022 toxic equivalents/g (mean (89 samples); the non-detect share counts congener results, not samples (see the lower-bound row), n = 89)
Measured on: CFIA 2014-2019 targeted survey, product 'Butter' (89 samples as above); upper bound = non-detects at the stated detection limit (detection limit); WHO2022 recompute
4 other measurements of this food
- EFSA 2026, European butter 2013-23, upper bound
Worth knowing
230greaches the limit in a weekCounted from zero, eaten alone: for scale only.An average adult’s intake is already at or past this limit before this food, so there is no room left to count grams against.1.866 pg (WHO 2022 toxic equivalents) per 10 g servingHow it’s rated
Flagged for women who are or may become pregnant and for breastfeeding women; no cap for other adults. EFSA's 2026 tolerable weekly intake for dioxins and PCBs is 0.6 pg/kg body weight/week, 42 pg for 70 kg. On EFSA's European butter data, the upper-bound mean of 0.23 pg/g of fat is 0.1866 pg/g of butter, and about 225.1 g a week eaten alone would reach the limit. A daily 10 g serving is 31.1% of it and adds 3.3% to 9.9% to the average adult's weekly exposure, far from doubling it. At the 95th percentile (0.3812 pg/g), 110.2 g a week would reach it and a daily serving is 63.5% of it.
Intake: one 10.0 g serving, 70 kg adult (Health Canada TRA H.1) · Level in the food: 0.187 pg WHO 2022 toxic equivalents/g (mean (N=116), n = 116)
Measured on: EFSA 2026 occurrence database, FoodEx2 level 3 'Butter', European samples 2013-2023; 0.23 pg/g fat x 0.8111 (FDC fat share) = per g whole butter
- EFSA 2026, European butter 2013-23, lower bound
Worth knowing
260greaches the limit in a weekCounted from zero, eaten alone: for scale only.An average adult’s intake is already at or past this limit before this food, so there is no room left to count grams against.1.622 pg (WHO 2022 toxic equivalents) per 10 g servingHow it’s rated
Flagged for women who are or may become pregnant and for breastfeeding women; no cap for other adults. EFSA's 2026 tolerable weekly intake for dioxins and PCBs is 0.6 pg/kg body weight/week, 42 pg for 70 kg. EFSA's European butter data, not Canadian: a lower-bound mean of 0.20 pg/g of fat (0.1622 pg/g butter). About 258.9 g a week eaten alone would reach the limit. A daily 10 g serving is 27.0% of it and adds 2.9% to 8.6% to the average adult's weekly exposure, far from doubling it.
Intake: one 10.0 g serving, 70 kg adult (Health Canada TRA H.1) · Level in the food: 0.162 pg WHO 2022 toxic equivalents/g (mean (N=116), n = 116)
Measured on: EFSA 2026 occurrence database, FoodEx2 level 3 'Butter', European samples 2013-2023; per g FAT 0.20 x FDC SR 173410 total lipid 0.8111 (81.11 g/100 g) = per g whole butter
- CFIA 2014-19 butter survey, lower bound
Worth knowing
680greaches the limit in a weekCounted from zero, eaten alone: for scale only.An average adult’s intake is already at or past this limit before this food, so there is no room left to count grams against.0.619 pg (WHO 2022 toxic equivalents) per 10 g servingCFIA dioxins survey (2014–2019) · grade A ?
How it’s rated
Flagged for women who are or may become pregnant and for breastfeeding women; no cap for other adults. EFSA's 2026 tolerable weekly intake for dioxins and PCBs is 0.6 pg/kg body weight/week, 42 pg for 70 kg. On the lower-bound mean of CFIA's 89 Canadian butter samples (0.0619 pg/g; 74% of congener results were below detection), about 678.5 g of butter a week eaten alone would reach it. Non-detects count as zero here, so the true amount could be lower. A daily 10 g serving is 10.3% of the weekly limit and adds 1.1% to 3.3% to the average adult's weekly exposure, far from doubling it.
Intake: one 10.0 g serving, 70 kg adult (Health Canada TRA H.1) · Level in the food: 0.062 pg WHO 2022 toxic equivalents/g (mean (89 samples); the non-detect share counts the 2,581 congener results (1,914 non-detect), not samples (4 of 89 samples have no detected congener), n = 89)
Measured on: CFIA 2014-2019 targeted survey, product 'Butter' (46 Domestic, 41 Unknown origin, 2 Import; sampled 2014-2017; fat 50.2-100%, mean 78.7%); pg/g of sample (wet weight); WHO2022 recompute from congener rows x EFSA 2026 Table 1 TEFs; CFIA's own totals are WHO2005
- CFIA 2012-14, butter and lard, per gram of fat
Context
No gram figure for this foodShown for context, not rated by dose: “How it’s rated” says why, so there is no gram figure here.CFIA 2012–2014 · grade B ?
How it’s rated
No grams figure: the basis is WHO2005 and per g fat, and the limit is WHO2022. Context beside the 2014-2019 and EFSA rows. Min 0.0007, max 1.8689 pg WHO 2005 toxic equivalents/g fat in the report.
Intake: one 10.0 g serving, 70 kg adult (Health Canada TRA H.1) · Level in the food: 0.16 pg WHO 2005 toxic equivalents/g fat (mean of positives (n=170 dairy butter/lard), n = 170)
Measured on: CFIA targeted survey April 2012 to March 2014, 'Dairy butter/lard' (45 domestic, 13 imported, 112 unspecified), pg toxic equivalents/g fat, 2005 WHO TEFs; includes 14 lard samples
- Butter, unsalted
Worth knowing for a 10 g serving
4%of the weekly limit in one 10 g serving, on top of what food already bringsFor scale: 230 g a week, eaten alone, would reach it.An average adult’s intake is already at or past this limit before this food, so there is no room left to count grams against.1.822 pg (WHO 2022 toxic equivalents) per 10 g servingCFIA dioxins survey (2014–2019) · grade A ?
How it’s rated
Flagged for women who are or may become pregnant and for breastfeeding women; no cap for other adults. EFSA's 2026 tolerable weekly intake for dioxins and PCBs is 0.6 pg/kg body weight/week, 42 pg for 70 kg. On the upper-bound mean of CFIA's 89 Canadian butter samples (0.1822 pg/g, non-detects counted at the detection limit), about 230.5 g of butter a week eaten alone would reach it, roughly 33 g a day. A daily 10 g serving is 30.4% of the weekly limit and adds 3.2% to 9.6% to the average adult's weekly exposure, far from doubling it. The salted figure is used; no unsalted data exist.
Intake: one 10.0 g serving, 70 kg adult (Health Canada TRA H.1) · Level in the food: 0.182 pg WHO 2022 toxic equivalents/g (mean (89 samples); the non-detect share counts congener results, not samples (see the lower-bound row), n = 89)
Measured on: CFIA 2014-2019 targeted survey, product 'Butter' (89 samples as above); upper bound = non-detects at the stated detection limit (detection limit); WHO2022 recompute
4 other measurements of this food
- EFSA 2026, European butter 2013-23, upper bound
Worth knowing
230greaches the limit in a weekCounted from zero, eaten alone: for scale only.An average adult’s intake is already at or past this limit before this food, so there is no room left to count grams against.1.866 pg (WHO 2022 toxic equivalents) per 10 g servingHow it’s rated
Flagged for women who are or may become pregnant and for breastfeeding women; no cap for other adults. EFSA's 2026 tolerable weekly intake for dioxins and PCBs is 0.6 pg/kg body weight/week, 42 pg for 70 kg. On EFSA's European butter data, the upper-bound mean of 0.23 pg/g of fat is 0.1866 pg/g of butter, and about 225.1 g a week eaten alone would reach the limit. A daily 10 g serving is 31.1% of it and adds 3.3% to 9.9% to the average adult's weekly exposure, far from doubling it. At the 95th percentile (0.3812 pg/g), 110.2 g a week would reach it and a daily serving is 63.5% of it. The salted figure is used; no unsalted data exist.
Intake: one 10.0 g serving, 70 kg adult (Health Canada TRA H.1) · Level in the food: 0.187 pg WHO 2022 toxic equivalents/g (mean (N=116), n = 116)
Measured on: EFSA 2026 occurrence database, FoodEx2 level 3 'Butter', European samples 2013-2023; 0.23 pg/g fat x 0.8111 (FDC fat share) = per g whole butter
- EFSA 2026, European butter 2013-23, lower bound
Worth knowing
260greaches the limit in a weekCounted from zero, eaten alone: for scale only.An average adult’s intake is already at or past this limit before this food, so there is no room left to count grams against.1.622 pg (WHO 2022 toxic equivalents) per 10 g servingHow it’s rated
Flagged for women who are or may become pregnant and for breastfeeding women; no cap for other adults. EFSA's 2026 tolerable weekly intake for dioxins and PCBs is 0.6 pg/kg body weight/week, 42 pg for 70 kg. EFSA's European butter data, not Canadian: a lower-bound mean of 0.20 pg/g of fat (0.1622 pg/g butter). About 258.9 g a week eaten alone would reach the limit. A daily 10 g serving is 27.0% of it and adds 2.9% to 8.6% to the average adult's weekly exposure, far from doubling it. The salted figure is used; no unsalted data exist.
Intake: one 10.0 g serving, 70 kg adult (Health Canada TRA H.1) · Level in the food: 0.162 pg WHO 2022 toxic equivalents/g (mean (N=116), n = 116)
Measured on: EFSA 2026 occurrence database, FoodEx2 level 3 'Butter', European samples 2013-2023; per g FAT 0.20 x FDC SR 173410 total lipid 0.8111 (81.11 g/100 g) = per g whole butter
- CFIA 2014-19 butter survey, lower bound
Worth knowing
680greaches the limit in a weekCounted from zero, eaten alone: for scale only.An average adult’s intake is already at or past this limit before this food, so there is no room left to count grams against.0.619 pg (WHO 2022 toxic equivalents) per 10 g servingCFIA dioxins survey (2014–2019) · grade A ?
How it’s rated
Flagged for women who are or may become pregnant and for breastfeeding women; no cap for other adults. EFSA's 2026 tolerable weekly intake for dioxins and PCBs is 0.6 pg/kg body weight/week, 42 pg for 70 kg. On the lower-bound mean of CFIA's 89 Canadian butter samples (0.0619 pg/g; 74% of congener results were below detection), about 678.5 g of butter a week eaten alone would reach it. Non-detects count as zero here, so the true amount could be lower. A daily 10 g serving is 10.3% of the weekly limit and adds 1.1% to 3.3% to the average adult's weekly exposure, far from doubling it. The salted figure is used; no unsalted data exist.
Intake: one 10.0 g serving, 70 kg adult (Health Canada TRA H.1) · Level in the food: 0.062 pg WHO 2022 toxic equivalents/g (mean (89 samples); the non-detect share counts the 2,581 congener results (1,914 non-detect), not samples (4 of 89 samples have no detected congener), n = 89)
Measured on: CFIA 2014-2019 targeted survey, product 'Butter' (46 Domestic, 41 Unknown origin, 2 Import; sampled 2014-2017; fat 50.2-100%, mean 78.7%); pg/g of sample (wet weight); WHO2022 recompute from congener rows x EFSA 2026 Table 1 TEFs; CFIA's own totals are WHO2005
- CFIA 2012-14, butter and lard, per gram of fat
Context
No gram figure for this foodShown for context, not rated by dose: “How it’s rated” says why, so there is no gram figure here.CFIA 2012–2014 · grade B ?
How it’s rated
No grams figure: the basis is WHO2005 and per g fat, and the limit is WHO2022. Context beside the 2014-2019 and EFSA rows. Min 0.0007, max 1.8689 pg WHO 2005 toxic equivalents/g fat in the report.
Intake: one 10.0 g serving, 70 kg adult (Health Canada TRA H.1) · Level in the food: 0.16 pg WHO 2005 toxic equivalents/g fat (mean of positives (n=170 dairy butter/lard), n = 170)
Measured on: CFIA targeted survey April 2012 to March 2014, 'Dairy butter/lard' (45 domestic, 13 imported, 112 unspecified), pg toxic equivalents/g fat, 2005 WHO TEFs; includes 14 lard samples
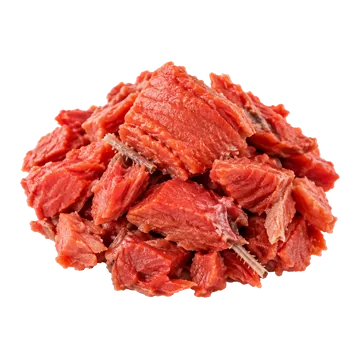 Sockeye salmon, canned
Worth knowing for a 55 g serving
18%of the weekly limit in one 55 g serving, on top of what food already bringsFor scale: 300 g a week, eaten alone, would reach it.An average adult’s intake is already at or past this limit before this food, so there is no room left to count grams against.7.7 pg (WHO 2022 toxic equivalents, upper bound) per 55 g servingCFIA dioxins survey (2014–2019) · grade B ?
How it’s rated
Flagged: EFSA's 2026 tolerable weekly intake (TWI) for dioxins and dioxin-like compounds is 0.6 pg WHO 2022 toxic equivalents/kg body weight/week, 42 pg a week. Eaten alone, about 300 g a week would reach it at the upper bound (735 g at the lower bound; upper-bound mean 0.1399 pg/g). Mean adult intake of 18.7-56.4 pg/day is already above the limit, so a 55 g serving adds 5.6% to 41%. This is a CFIA category figure (66 samples, 2017-2018) whose form (fresh, frozen, canned, species) is not stated.
Intake: 55 g canned (HC TRA I.4), one serving a day · Level in the food: 0.14 pg WHO 2022 toxic equivalents/g (mean, n = 66)
Measured on: CFIA targeted survey 2014-2019, product 'Salmon', 66 samples 2017-2018 (United States 50, Canada 9, China 3, others 4); THE FORM (fresh, frozen, canned, species) IS NOT STATED. File totals are WHO 2005 (mean lower bound 0.0909, upper bound 0.1940 pg toxic equivalents/g; our WHO 2005 recomputation gives 0.0946 and 0.2021); the WHO 2022 value is our recomputation from the congener rows: mean lower bound 0.0571, upper bound 0.1399, median lower bound 0.0127.
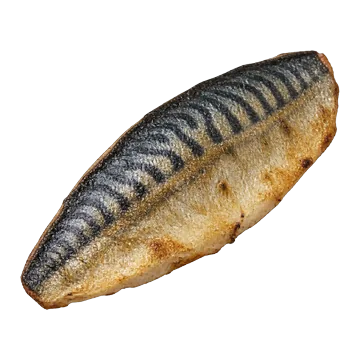 Mackerel, cooked
Worth knowing for a 100 g serving
29%of the weekly limit in one 100 g serving, on top of what food already bringsFor scale: 340 g a week, eaten alone, would reach it.An average adult’s intake is already at or past this limit before this food, so there is no room left to count grams against.12.32 pg (WHO 2022 toxic equivalents) per 100 g servingCFIA dioxins survey (2014–2019) · grade B ?
How it’s rated
Flagged for women who are or may become pregnant and for breastfeeding; no cap for other adults. The CFIA 2014-2019 figures are for "Mackerel" (11 samples, species and form not given), so this is a life-stage flag, not an Atlantic-mackerel rating. A daily serving is 205% of EFSA's 2026 tolerable weekly intake (0.6 pg/kg body weight/week) on the lower-bound mean and 393% on the upper; one serving a week 29-56%. The one Canadian sample (26.4% fat, probably Atlantic) gives 63-325% a day. One Chinese sample (upper bound 0.51 pg/g) drives the mean.
Intake: one 100 g cooked serving a day, 70 kg adult; concentration = raw x1.282 (Foodtopsy's arithmetic) · Level in the food: 0.096 pg WHO 2022 toxic equivalents/g (mean (11 samples), n = 11)
Measured on: category: CFIA 2014-2019 'Mackerel' (11 samples: China 3, Chile 2, Japan, Korea, Philippines, Taiwan, Poland, one domestic Canada); species and canned/fresh form not stated; Asian and Chilean samples probably Pacific species (inference). Recomputed on WHO 2022 TEFs from the congener rows
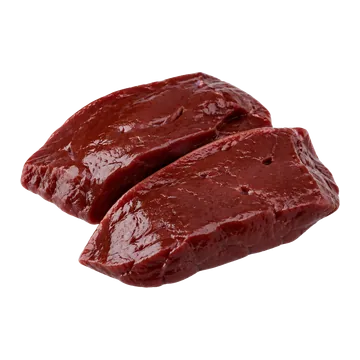 Beef liver, raw
Worth knowing
380greaches the limit in a weekCounted from zero, eaten alone: for scale only.An average adult’s intake is already at or past this limit before this food, so there is no room left to count grams against.How it’s rated
Flagged: the tolerable weekly intake for dioxins and PCBs is 42 pg a week at 70 kg (EFSA 2026, WHO 2022 toxic equivalents). On the upper-bound European mean of 0.11 pg/g (522 samples), about 382 g of raw liver a week would reach it, and a 100 g serving is 26% of the weekly limit. It pairs with the lower-bound row to give the two bounds.
Intake: 100 g raw serving · Level in the food: 0.11 pg WHO 2022 toxic equivalents/g (mean (522 samples), n = 522)
Measured on: EFSA 2026 update, European food occurrence data, FoodEx2 'Bovine liver', pg toxic equivalents/g whole weight; upper bound
1 other measurement of this food
- EFSA 2026, European liver, lower bound
Worth knowing
420greaches the limit in a weekCounted from zero, eaten alone: for scale only.An average adult’s intake is already at or past this limit before this food, so there is no room left to count grams against.How it’s rated
Flagged: EFSA's 2026 tolerable weekly intake for dioxins and PCBs is 0.6 pg WHO 2022 toxic equivalents/kg body weight/week, 42 pg a week at 70 kg. On the European lower-bound mean of 0.10 pg/g (522 samples, whole weight, as sampled), about 420 g of raw liver a week would reach it, an upper bound on the grams (382 g at the upper bound of 0.11). A 100 g serving carries 10 pg, 24% of the weekly limit. These are European data; Canada's CFIA survey has no liver sample.
Intake: 100 g raw serving · Level in the food: 0.1 pg WHO 2022 toxic equivalents/g (mean (522 samples), n = 522)
Measured on: EFSA 2026 update, European food occurrence data, FoodEx2 'Bovine liver' (animal liver), pg toxic equivalents/g whole weight, sum of 29 PCDD/Fs and dl-PCBs; as sampled (raw or cooked not stated)
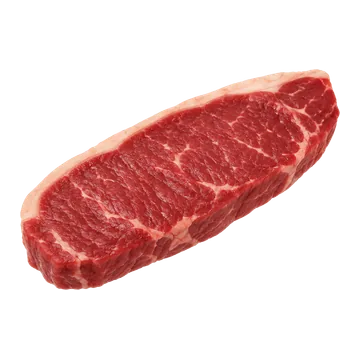 Beef steak, top loin, raw
Worth knowing
400greaches the limit in a weekCounted from zero, eaten alone: for scale only.An average adult’s intake is already at or past this limit before this food, so there is no room left to count grams against.CFIA dioxins survey (2014–2019) · grade A ?
How it’s rated
Raw meat as bought: CFIA sampled raw meat, so these are grams of raw meat, not cooked weight (cooking drives off water and keeps the fat-soluble congeners). Most congener results were below detection (76-85%), so both the lower and the upper bound are shown. Flagged for women who are or may become pregnant or are breastfeeding, not a cap for the default adult. At the upper bound (non-detects counted at their detection limit), about 405 g of raw beef a week would reach the tolerable weekly intake of 0.6 pg WHO 2022 toxic equivalents/kg body weight/week, eaten alone. One 100 g cooked serving, using the raw-meat level, carries 10.38 pg, 24.7% of the weekly limit; a serving every day is 173% of it and adds 18.3% to 55.0% to the average adult's intake (0.27-0.81 pg/kg body weight/day, EFSA 2026). The bounds differ about fivefold (76.6% of congener results are below detection), so neither is the figure; the lower bound puts a daily serving at 37% of the weekly limit.
Intake: one 100 g cooked serving a day, 70 kg adult · Level in the food: 0.104 pg WHO 2022 toxic equivalents/g (mean (134 samples), n = 134)
Measured on: AS SAMPLED (retail cuts as received; raw or cooked is not stated by CFIA, almost certainly raw), NOT converted to cooked weight and NOT as eaten: no sourced raw-to-cooked factor exists in what I opened. CFIA 2014-2019 targeted survey, Product "Beef" (134 samples collected 2015-2018; mean fat 15.9%); pg/g of total sample weight (preparation not stated in the overview); WHO2022 recompute from congener rows × EFSA 2026 Table 1 TEFs (Foodtopsy's arithmetic); CFIA's own totals are WHO2005. Origins Import 68, Domestic 62, Unknown 4; sampled 2015 (18), 2016 (4), 2017 (89), 2018 (23); samples with no detected congener 5. The non-detect share counts congener results, not samples
1 other measurement of this food
- CFIA 2014-19, raw beef, lower bound
Worth knowing
1,900greaches the limit in a weekCounted from zero, eaten alone: for scale only.An average adult’s intake is already at or past this limit before this food, so there is no room left to count grams against.CFIA dioxins survey (2014–2019) · grade A ?
How it’s rated
Raw meat as bought: CFIA sampled raw meat, so these are grams of raw meat, not cooked weight (cooking drives off water and keeps the fat-soluble congeners). Most congener results were below detection (76-85%), so both the lower and the upper bound are shown. Flagged for women who are or may become pregnant or are breastfeeding, not a cap for the default adult. At the lower bound (non-detects counted as zero), about 1,888 g of raw beef a week would reach the tolerable weekly intake of 0.6 pg WHO 2022 toxic equivalents/kg body weight/week, eaten alone. One 100 g cooked serving, using the raw-meat level, carries 2.23 pg, 5.3% of the weekly limit; a serving every day is 37% of it and adds 3.9% to 11.8% to the average adult's intake (0.27-0.81 pg/kg body weight/day, EFSA 2026). The bounds differ about fivefold (76.6% of congener results are below detection), so neither is the figure; the lower bound already puts a daily serving at 37% of the weekly limit and the upper bound at 173%.
Intake: one 100 g cooked serving a day, 70 kg adult · Level in the food: 0.022 pg WHO 2022 toxic equivalents/g (mean (134 samples), n = 134)
Measured on: AS SAMPLED (retail cuts as received; raw or cooked is not stated by CFIA, almost certainly raw), NOT converted to cooked weight and NOT as eaten: no sourced raw-to-cooked factor exists in what I opened. CFIA 2014-2019 targeted survey, Product "Beef" (134 samples collected 2015-2018; mean fat 15.9%); pg/g of total sample weight (preparation not stated in the overview); WHO2022 recompute from congener rows × EFSA 2026 Table 1 TEFs (Foodtopsy's arithmetic); CFIA's own totals are WHO2005. Origins Import 68, Domestic 62, Unknown 4; sampled 2015 (18), 2016 (4), 2017 (89), 2018 (23); samples with no detected congener 5. The non-detect share counts congener results, not samples
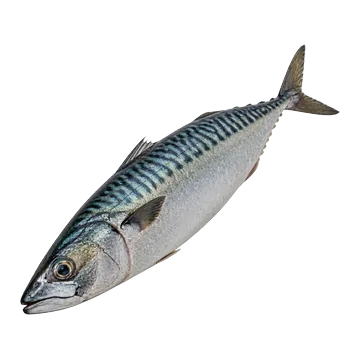 Mackerel, raw
Worth knowing for a 125 g serving
29%of the weekly limit in one 125 g serving, on top of what food already bringsFor scale: 440 g a week, eaten alone, would reach it.An average adult’s intake is already at or past this limit before this food, so there is no room left to count grams against.12.01 pg (WHO 2022 toxic equivalents) per 125 g servingCFIA dioxins survey (2014–2019) · grade B ?
How it’s rated
Flagged for women who are or may become pregnant and for breastfeeding; no cap for other adults. The CFIA 2014-2019 figures are for "Mackerel" (11 samples, species and form not given), so this is a life-stage flag, not an Atlantic-mackerel rating. A daily serving is 200% of EFSA's 2026 tolerable weekly intake (0.6 pg/kg body weight/week) on the lower-bound mean and 383% on the upper; one serving a week 29-55%. The one Canadian sample (26.4% fat, probably Atlantic) gives 61-317% a day. One Chinese sample (upper bound 0.51 pg/g) drives the mean.
Intake: one 125 g raw serving a day, 70 kg adult · Level in the food: 0.096 pg WHO 2022 toxic equivalents/g (mean (11 samples), n = 11)
Measured on: category: CFIA 2014-2019 'Mackerel' (11 samples: China 3, Chile 2, Japan, Korea, Philippines, Taiwan, Poland, one domestic Canada); species and canned/fresh form not stated; Asian and Chilean samples probably Pacific species (inference). Recomputed on WHO 2022 TEFs from the congener rows
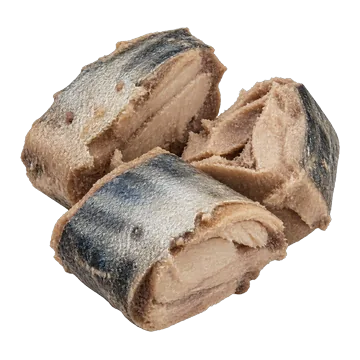 Mackerel, canned
Worth knowing for a 55 g serving
13%of the weekly limit in one 55 g serving, on top of what food already bringsFor scale: 440 g a week, eaten alone, would reach it.An average adult’s intake is already at or past this limit before this food, so there is no room left to count grams against.5.29 pg (WHO 2022 toxic equivalents) per 55 g servingCFIA dioxins survey (2014–2019) · grade B ?
How it’s rated
Flagged for women who are or may become pregnant and for breastfeeding; no cap for other adults. The CFIA 2014-2019 figures are for "Mackerel" (11 samples, species and form not given), so this is a life-stage flag, not an Atlantic-mackerel rating. A daily serving is 88% of EFSA's 2026 tolerable weekly intake (0.6 pg/kg body weight/week) on the lower-bound mean and 169% on the upper; one serving a week 13-24%. The one Canadian sample (26.4% fat, probably Atlantic) gives 27-139% a day. One Chinese sample (upper bound 0.51 pg/g) drives the mean.
Intake: one 55 g drained serving a day, 70 kg adult · Level in the food: 0.096 pg WHO 2022 toxic equivalents/g (mean (11 samples), n = 11)
Measured on: category: CFIA 2014-2019 'Mackerel' (11 samples: China 3, Chile 2, Japan, Korea, Philippines, Taiwan, Poland, one domestic Canada); species and canned/fresh form not stated; Asian and Chilean samples probably Pacific species (inference). Recomputed on WHO 2022 TEFs from the congener rows
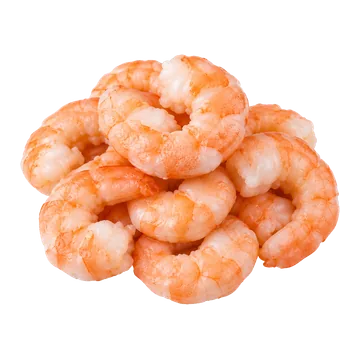 Shrimp, cooked
Worth knowing for a 100 g serving
20%of the weekly limit in one 100 g serving, on top of what food already bringsFor scale: 490 g a week, eaten alone, would reach it.An average adult’s intake is already at or past this limit before this food, so there is no room left to count grams against.8.5 pg (WHO 2022 toxic equivalents, upper bound) per 100 g servingCFIA dioxins survey (2014–2019) · grade B ?
How it’s rated
Flagged: EFSA's 2026 tolerable weekly intake (TWI) for dioxins and dioxin-like compounds is 0.6 pg WHO 2022 toxic equivalents/kg body weight/week, 42 pg a week. Eaten alone, about 493 g a week would reach it at the upper bound (4,600 g at the lower bound); the upper bound is mostly detection-limit contribution, and the two bounds differ 9-fold. Mean adult intake of 18.7-56.4 pg/day is already above the limit, so one 100 g serving adds 1.6% to 46%. Based on 25 CFIA samples (imports, 2017-2018); the preparation is not stated.
Intake: 100 g cooked (HC TRA I.3), one serving a day · Level in the food: 0.085 pg WHO 2022 toxic equivalents/g (mean, n = 25)
Measured on: CFIA targeted survey 2014-2019, product 'Shrimp', 25 samples (imports: Vietnam, India and others, 2017-2018), fat 0.08 to 17.9% (median 0.7%; seven samples at 7 to 18%); preparation not stated. The file's own totals are WHO 2005 (mean lower bound 0.0082, upper bound 0.0983 pg toxic equivalents/g; our WHO 2005 recomputation gives 0.0083 and 0.103); the WHO 2022 value is our recomputation from the congener rows: mean lower bound 0.0091, upper bound 0.0852.
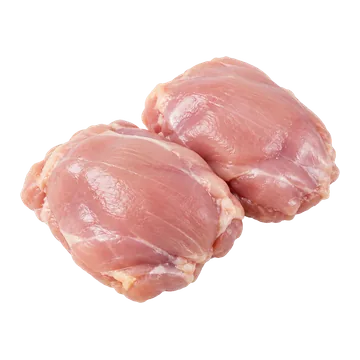 Chicken thigh, raw
Worth knowing
570greaches the limit in a weekCounted from zero, eaten alone: for scale only.An average adult’s intake is already at or past this limit before this food, so there is no room left to count grams against.CFIA dioxins survey (2014–2019) · grade A ?
How it’s rated
Raw meat as bought: CFIA sampled raw meat, so these are grams of raw meat, not cooked weight (cooking drives off water and keeps the fat-soluble congeners). Most congener results were below detection (76-85%), so both the lower and the upper bound are shown. Flagged for women who are or may become pregnant or are breastfeeding, not a cap for the default adult. At the upper bound (non-detects counted at their detection limit), about 571 g of raw chicken a week would reach the tolerable weekly intake of 0.6 pg WHO 2022 toxic equivalents/kg body weight/week, eaten alone. One 100 g cooked serving, using the raw-meat level, carries 7.36 pg, 17.5% of the weekly limit; a serving every day is 123% of it and adds 13.0% to 39.0% to the average adult's intake (0.27-0.81 pg/kg body weight/day, EFSA 2026). The bounds differ about twenty-fold (85% of congener results are below detection), so neither is the figure.
Intake: one 100 g cooked serving a day, 70 kg adult · Level in the food: 0.074 pg WHO 2022 toxic equivalents/g (mean (101 samples), n = 101)
Measured on: AS SAMPLED (retail cuts as received; raw or cooked is not stated by CFIA, almost certainly raw), NOT converted to cooked weight and NOT as eaten: no sourced raw-to-cooked factor exists in what I opened. CFIA 2014-2019 targeted survey, Product "Chicken" (101 samples collected 2015-2018; mean fat 8.5%); pg/g of total sample weight (preparation not stated in the overview); WHO2022 recompute from congener rows × EFSA 2026 Table 1 TEFs (Foodtopsy's arithmetic); CFIA's own totals are WHO2005. Origins Domestic 57, Import 31, Unknown 13; samples with no detected congener 4. The non-detect share counts congener results, not samples
1 other measurement of this food
- CFIA 2014-19, raw chicken, lower bound
Worth knowing
13,000greaches the limit in a weekCounted from zero, eaten alone: for scale only.An average adult’s intake is already at or past this limit before this food, so there is no room left to count grams against.CFIA dioxins survey (2014–2019) · grade A ?
How it’s rated
Raw meat as bought: CFIA sampled raw meat, so these are grams of raw meat, not cooked weight (cooking drives off water and keeps the fat-soluble congeners). Most congener results were below detection (76-85%), so both the lower and the upper bound are shown. Flagged for women who are or may become pregnant or are breastfeeding, not a cap for the default adult. At the lower bound (non-detects counted as zero), about 13,003 g of raw chicken a week would reach the tolerable weekly intake of 0.6 pg WHO 2022 toxic equivalents/kg body weight/week, eaten alone. One 100 g cooked serving, using the raw-meat level, carries 0.32 pg, 0.8% of the weekly limit; a serving every day is 5% of it and adds 0.6% to 1.7% to the average adult's intake (0.27-0.81 pg/kg body weight/day, EFSA 2026). The bounds differ about twenty-fold (85% of congener results are below detection), so neither is the figure.
Intake: one 100 g cooked serving a day, 70 kg adult · Level in the food: 0.003 pg WHO 2022 toxic equivalents/g (mean (101 samples), n = 101)
Measured on: AS SAMPLED (retail cuts as received; raw or cooked is not stated by CFIA, almost certainly raw), NOT converted to cooked weight and NOT as eaten: no sourced raw-to-cooked factor exists in what I opened. CFIA 2014-2019 targeted survey, Product "Chicken" (101 samples collected 2015-2018; mean fat 8.5%); pg/g of total sample weight (preparation not stated in the overview); WHO2022 recompute from congener rows × EFSA 2026 Table 1 TEFs (Foodtopsy's arithmetic); CFIA's own totals are WHO2005. Origins Domestic 57, Import 31, Unknown 13; samples with no detected congener 4. The non-detect share counts congener results, not samples
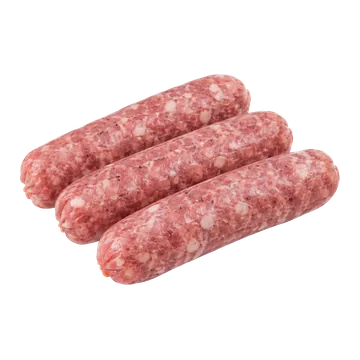 Pork sausage, raw
Worth knowing
590greaches the limit in a weekCounted from zero, eaten alone: for scale only.An average adult’s intake is already at or past this limit before this food, so there is no room left to count grams against.CFIA dioxins survey (2014–2019) · grade B ?
How it’s rated
Raw meat as bought: CFIA sampled raw meat, so these are grams of raw meat, not cooked weight (cooking drives off water and keeps the fat-soluble congeners). Most congener results were below detection (76-85%), so both the lower and the upper bound are shown. Flagged for women who are or may become pregnant or are breastfeeding, not a cap for the default adult. These are raw pork cuts sold at retail, not sausage, so the evidence is for a related food. At the upper bound (non-detects counted at their detection limit), about 591 g a week would reach the tolerable weekly intake of 0.6 pg WHO 2022 toxic equivalents/kg body weight/week, eaten alone. One 55 g cooked serving, using the raw-meat level, carries 3.91 pg, 9.3% of the weekly limit; a serving every day is 65% of it and adds 6.9% to 20.7% to the average adult's intake (0.27-0.81 pg/kg body weight/day, EFSA 2026). Neither bound is the figure (85.4% of congener results are below detection). Applying the same samples' level per gram of fat to the 27.25 g of fat in 100 g of cooked sausage would give about 202 g a week, an estimate, not a measurement; detection limits on low-fat samples inflate the per-fat upper bound.
Intake: one 55 g cooked serving a day, 70 kg adult · Level in the food: 0.071 pg WHO 2022 toxic equivalents/g (mean (129 samples), n = 129)
Measured on: AS SAMPLED (retail cuts as received; raw or cooked is not stated by CFIA, almost certainly raw), NOT converted to cooked weight and NOT as eaten: no sourced raw-to-cooked factor exists in what I opened. CFIA 2014-2019 targeted survey, Product "Pork" (129 samples collected 2015-2018; mean fat 14.1%); pg/g of total sample weight (preparation not stated in the overview); WHO2022 recompute from congener rows × EFSA 2026 Table 1 TEFs (Foodtopsy's arithmetic); CFIA's own totals are WHO2005. Product group is raw pork cuts as sold (not sausage; "Pork" 128 samples plus one lower-case "pork"); origin Import 59, Domestic 59, Unknown 11; sampled 2015 (57), 2016 (12), 2017 (43), 2018 (17); samples with no detected congener 11. GRADE B: a related food. The non-detect share counts congener results, not samples
1 other measurement of this food
- CFIA 2014-19, raw pork, lower bound
Worth knowing
11,000greaches the limit in a weekCounted from zero, eaten alone: for scale only.An average adult’s intake is already at or past this limit before this food, so there is no room left to count grams against.CFIA dioxins survey (2014–2019) · grade B ?
How it’s rated
Raw meat as bought: CFIA sampled raw meat, so these are grams of raw meat, not cooked weight (cooking drives off water and keeps the fat-soluble congeners). Most congener results were below detection (76-85%), so both the lower and the upper bound are shown. Flagged for women who are or may become pregnant or are breastfeeding, not a cap for the default adult. These are raw pork cuts sold at retail, not sausage, so the evidence is for a related food. At the lower bound (non-detects counted as zero), about 10,742 g a week would reach the tolerable weekly intake of 0.6 pg WHO 2022 toxic equivalents/kg body weight/week, eaten alone. One 55 g cooked serving, using the raw-meat level, carries 0.22 pg, 0.5% of the weekly limit; a serving every day is 4% of it and adds 0.4% to 1.1% to the average adult's intake (0.27-0.81 pg/kg body weight/day, EFSA 2026). Neither bound is the figure (85.4% of congener results are below detection). Applying the same samples' level per gram of fat to the 27.25 g of fat in 100 g of cooked sausage would give about 3,844 g a week, an estimate, not a measurement.
Intake: one 55 g cooked serving a day, 70 kg adult · Level in the food: 0.004 pg WHO 2022 toxic equivalents/g (mean (129 samples), n = 129)
Measured on: AS SAMPLED (retail cuts as received; raw or cooked is not stated by CFIA, almost certainly raw), NOT converted to cooked weight and NOT as eaten: no sourced raw-to-cooked factor exists in what I opened. CFIA 2014-2019 targeted survey, Product "Pork" (129 samples collected 2015-2018; mean fat 14.1%); pg/g of total sample weight (preparation not stated in the overview); WHO2022 recompute from congener rows × EFSA 2026 Table 1 TEFs (Foodtopsy's arithmetic); CFIA's own totals are WHO2005. Product group is raw pork cuts as sold (not sausage; "Pork" 128 samples plus one lower-case "pork"); origin Import 59, Domestic 59, Unknown 11; sampled 2015 (57), 2016 (12), 2017 (43), 2018 (17); samples with no detected congener 11. GRADE B: a related food. The non-detect share counts congener results, not samples
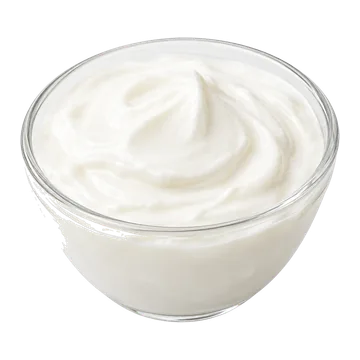 Heavy cream
Worth knowing for a 15.1 g serving
2%of the weekly limit in one 15.1 g serving, on top of what food already bringsFor scale: 610 g a week, eaten alone, would reach it.An average adult’s intake is already at or past this limit before this food, so there is no room left to count grams against.1.047 pg (WHO 2022 toxic equivalents) per 15.1 g servingCFIA dioxins in dairy (2019–2021) · grade A ?
How it’s rated
Flagged for women who are or may become pregnant and for breastfeeding women; no cap for other adults. EFSA's 2026 tolerable weekly intake for dioxins and PCBs is 0.6 pg/kg body weight/week, 42 pg for 70 kg. On the upper-bound mean of the same 31 CFIA samples (0.0694 pg/g), about 606 g a week eaten alone would reach it. A 15 mL serving (15.1 g) is 2.49% of the weekly limit, and a daily one 17.4%, adding 1.8% to 5.5% to the average adult's weekly exposure, far from doubling it.
Intake: one 15 mL (1 tbsp; 15.1 g) serving, 70 kg adult (Health Canada TRA) · Level in the food: 0.069 pg WHO 2022 toxic equivalents/g (mean, n = 31)
Measured on: CFIA 2019-2021 dairy targeted survey, product 'Cream', fat 25% and over (whipping and heavy cream): n = 31 samples (fat 25.4% to 46.8%, n = 31; mean fat 32.0%); all of Canadian origin, sampled 2019-2021; pg/g of sample (wet weight); WHO2022 recompute from congener rows x EFSA 2026 Table 1 TEFs; CFIA's own totals are WHO2005
1 other measurement of this food
- CFIA 2019-21 cream survey, whipping cream, lower bound
Worth knowing
1,300greaches the limit in a weekCounted from zero, eaten alone: for scale only.An average adult’s intake is already at or past this limit before this food, so there is no room left to count grams against.0.49 pg (WHO 2022 toxic equivalents) per 15.1 g servingCFIA dioxins in dairy (2019–2021) · grade A ?
How it’s rated
Flagged for women who are or may become pregnant and for breastfeeding women; no cap for other adults. EFSA's 2026 tolerable weekly intake for dioxins and PCBs is 0.6 pg/kg body weight/week, 42 pg for 70 kg. On the lower-bound mean of 31 CFIA heavy-cream samples (0.0325 pg/g; 65.9% of congener results were below detection), about 1,294 g a week eaten alone would reach it; non-detects count as zero, so the true amount could be lower. A 15 mL serving (15.1 g) is 1.17% of the weekly limit, and a daily one 8.2%, adding 0.9% to 2.6% to the average adult's weekly exposure, far from doubling it.
Intake: one 15 mL (1 tbsp; 15.1 g) serving, 70 kg adult (Health Canada TRA) · Level in the food: 0.033 pg WHO 2022 toxic equivalents/g (mean, n = 31)
Measured on: CFIA 2019-2021 dairy targeted survey, product 'Cream', fat 25% and over (whipping and heavy cream): n = 31 samples (fat 25.4% to 46.8%, n = 31; mean fat 32.0%); all of Canadian origin, sampled 2019-2021; pg/g of sample (wet weight); WHO2022 recompute from congener rows x EFSA 2026 Table 1 TEFs; CFIA's own totals are WHO2005
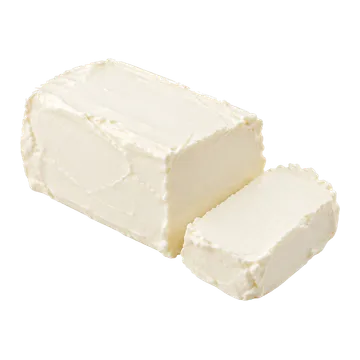 Cream cheese
Worth knowing for a 30 g serving
5%of the weekly limit in one 30 g serving, on top of what food already bringsFor scale: 610 g a week, eaten alone, would reach it.An average adult’s intake is already at or past this limit before this food, so there is no room left to count grams against.2.081 pg per 30 g servingCFIA dioxins in dairy (2019–2021) · grade B ?
How it’s rated
Flagged for life stage, with no cap for the default adult: the tolerable weekly intake for dioxins and PCBs is 42 pg (EFSA 2026, WHO 2022 toxic equivalents). On the upper-bound mean of 0.06936 pg/g (the same CFIA cream proxy), about 606 g a week eaten alone would reach it. One serving is 4.95% of the weekly limit, a daily serving 34.7%.
Intake: one 30 g serving (HC TRA D.1), 70 kg adult; weekly limit 0.6 pg/kg body weight = 42 pg · Level in the food: 0.069 pg WHO 2022 toxic equivalents/g (mean (recomputed on WHO2022 TEFs from the CFIA congener rows; 31 cream samples with 25% fat and over), n = 31)
Measured on: PROXY: CFIA Food Safety Action Plan targeted survey, dioxins and dioxin-like compounds in dairy 2019-2021, product 'Cream' (no cream cheese category), fat band 25% and over (mean 32.0%, whipping and heavy cream), Canada, sampled 2019 (5), 2020 (20), 2021 (6); pg/g of sample (wet weight)
1 other measurement of this food
- CFIA 2019-21, cream standing in, lower bound
Worth knowing
1,300greaches the limit in a weekCounted from zero, eaten alone: for scale only.An average adult’s intake is already at or past this limit before this food, so there is no room left to count grams against.0.974 pg per 30 g servingCFIA dioxins in dairy (2019–2021) · grade B ?
How it’s rated
Flagged for life stage, with no cap for the default adult: EFSA's 2026 tolerable weekly intake for dioxins and PCBs is 0.6 pg WHO 2022 toxic equivalents/kg body weight/week, 42 pg. On a lower-bound mean of 0.03246 pg/g (a proxy from the CFIA dairy survey, 31 cream samples with 25% fat and over, recomputed on WHO2022 factors), about 1,294 g a week eaten alone would reach it, an upper bound on the grams. One serving is 2.32% of the weekly limit, a daily serving 16.2%.
Intake: one 30 g serving (HC TRA D.1), 70 kg adult; weekly limit 0.6 pg/kg body weight = 42 pg · Level in the food: 0.032 pg WHO 2022 toxic equivalents/g (mean (recomputed on WHO2022 TEFs from the CFIA congener rows; 31 cream samples with 25% fat and over), n = 31)
Measured on: PROXY: CFIA Food Safety Action Plan targeted survey, dioxins and dioxin-like compounds in dairy 2019-2021, product 'Cream' (no cream cheese category), fat band 25% and over (mean 32.0%, whipping and heavy cream), Canada, sampled 2019 (5), 2020 (20), 2021 (6); pg/g of sample (wet weight)
 Ice cream, vanilla
Worth knowing for a 105 g serving
17%of the weekly limit in one 105 g serving, on top of what food already bringsFor scale: 610 g a week, eaten alone, would reach it.An average adult’s intake is already at or past this limit before this food, so there is no room left to count grams against.7.275 pg (WHO 2022 toxic equivalents) per 105 g servingCFIA dioxins survey (2014–2019) · grade B ?
How it’s rated
Flagged for women who are or may become pregnant and for breastfeeding women; no cap for other adults. EFSA's 2026 tolerable weekly intake for dioxins and PCBs is 0.6 pg/kg body weight/week, 42 pg for 70 kg. The data are for frozen dairy desserts, not labelled ice cream (46 CFIA samples). On the upper-bound mean (0.0693 pg/g), about 606 g a week eaten alone would reach it. A 188 mL serving (105 g) is 17.32% of the weekly limit, and a daily one 121.2%, above the limit on its own. It adds 12.8% to 38.6% to the average adult's weekly exposure, short of doubling it. The two bounds are four times apart, so neither is the figure.
Intake: one 188 mL (3/4 cup; 104.9 g) serving, 70 kg adult (Health Canada TRA) · Level in the food: 0.069 pg WHO 2022 toxic equivalents/g (mean, n = 46)
Measured on: CFIA 2014-2019 targeted survey, product 'Dessert - Frozen (Dairy)': n = 46 samples (sampled 2014 (13), 2015 (2), 2018 (26), 2019 (5) by date; origin Canada 14, United States 9, unknown 23; fat 0.2% to 32.1%, mean 12.5%); pg/g of sample (wet weight); WHO2022 recompute from congener rows x EFSA 2026 Table 1 TEFs; CFIA's own totals are WHO2005. CATEGORY: the product group is frozen dairy desserts, not labelled ice cream
1 other measurement of this food
- CFIA 2014-19, frozen dairy desserts, lower bound
Worth knowing
2,500greaches the limit in a weekCounted from zero, eaten alone: for scale only.An average adult’s intake is already at or past this limit before this food, so there is no room left to count grams against.1.757 pg (WHO 2022 toxic equivalents) per 105 g servingCFIA dioxins survey (2014–2019) · grade B ?
How it’s rated
Flagged for women who are or may become pregnant and for breastfeeding women; no cap for other adults. EFSA's 2026 tolerable weekly intake for dioxins and PCBs is 0.6 pg/kg body weight/week, 42 pg for 70 kg. The data are for frozen dairy desserts, not labelled ice cream (46 CFIA samples). On the lower-bound mean (0.0167 pg/g; 75.6% of congener results were below detection), about 2,508 g a week eaten alone would reach it; non-detects count as zero, so the true amount could be lower. A 188 mL serving (105 g) is 4.18% of the weekly limit, and a daily one 29.3%, adding 3.1% to 9.3% to the average adult's weekly exposure, far from doubling it.
Intake: one 188 mL (3/4 cup; 104.9 g) serving, 70 kg adult (Health Canada TRA) · Level in the food: 0.017 pg WHO 2022 toxic equivalents/g (mean, n = 46)
Measured on: CFIA 2014-2019 targeted survey, product 'Dessert - Frozen (Dairy)': n = 46 samples (sampled 2014 (13), 2015 (2), 2018 (26), 2019 (5) by date; origin Canada 14, United States 9, unknown 23; fat 0.2% to 32.1%, mean 12.5%); pg/g of sample (wet weight); WHO2022 recompute from congener rows x EFSA 2026 Table 1 TEFs; CFIA's own totals are WHO2005. CATEGORY: the product group is frozen dairy desserts, not labelled ice cream
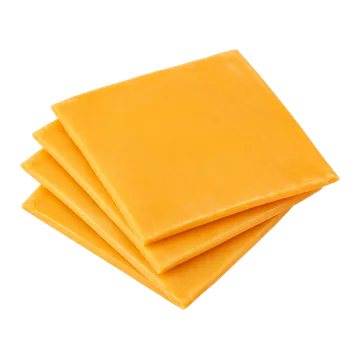 Processed cheese slices
Worth knowing for a 30 g serving
4%of the weekly limit in one 30 g serving, on top of what food already bringsFor scale: 730 g a week, eaten alone, would reach it.An average adult’s intake is already at or past this limit before this food, so there is no room left to count grams against.1.738 pg (WHO 2022 toxic equivalents) per 30 g servingCFIA dioxins in dairy (2019–2021) · grade B ?
How it’s rated
Flagged for women who are or may become pregnant and for breastfeeding women; no cap for other adults. EFSA's 2026 tolerable weekly intake for dioxins and PCBs is 0.6 pg/kg body weight/week, 42 pg for 70 kg. The data cover all cheese types; processed cheese cannot be told apart. On the upper-bound mean of the same 120 CFIA samples (0.0579 pg/g), about 725 g a week eaten alone would reach it. A 30 g serving is 4.14% of the weekly limit, and a daily one 29.0%, adding 3.1% to 9.2% to the average adult's weekly exposure, far from doubling it.
Intake: one 30 g serving, 70 kg adult (Health Canada TRA) · Level in the food: 0.058 pg WHO 2022 toxic equivalents/g (mean, n = 120)
Measured on: CFIA 2019-2021 dairy targeted survey, product 'Cheese' (ALL cheese types, no type flag): n = 120 samples (Domestic 78, Import 28, Unknown 14; sampled 2019 (30), 2020 (63), 2021 (27); mean fat 27.7%, fat 5.7% to 49.2%); pg/g of sample (wet weight); WHO2022 recompute from congener rows x EFSA 2026 Table 1 TEFs; CFIA's own totals are WHO2005. CATEGORY, not processed American cheese: the data cannot identify processed cheese
3 other measurements of this food
- EFSA 2026, European cheese 2013-23, upper bound
Worth knowing
460greaches the limit in a weekCounted from zero, eaten alone: for scale only.An average adult’s intake is already at or past this limit before this food, so there is no room left to count grams against.2.754 pg (WHO 2022 toxic equivalents) per 30 g servingHow it’s rated
Flagged for women who are or may become pregnant and for breastfeeding women; no cap for other adults. EFSA's 2026 tolerable weekly intake for dioxins and PCBs is 0.6 pg/kg body weight/week, 42 pg for 70 kg. On EFSA's data for cheese of all types in Europe (923 samples), the upper-bound mean of 0.30 pg/g of fat is 0.0918 pg/g at American cheese's 30.6% fat. About 458 g a week eaten alone would reach the limit. A 30 g serving is 6.56% of it, and a daily one 45.9%, adding 4.9% to 14.6% to the average adult's weekly exposure, far from doubling it.
Intake: one 30 g serving, 70 kg adult (Health Canada TRA) · Level in the food: 0.092 pg WHO 2022 toxic equivalents/g (mean, n = 923)
Measured on: EFSA 2026 Table 11, FoodEx2 level 2 'Cheese' (milk and dairy products; N = 923; European occurrence data 2013-2023), WHO2022 mean upper bound 0.30 pg WHO-toxic equivalents/g FAT x 0.306 (Foundation 325198 total lipid 30.6 g/100 g) = 0.0918 pg/g of processed American cheese
- EFSA 2026, European cheese 2013-23, lower bound
Worth knowing
570greaches the limit in a weekCounted from zero, eaten alone: for scale only.An average adult’s intake is already at or past this limit before this food, so there is no room left to count grams against.2.203 pg (WHO 2022 toxic equivalents) per 30 g servingHow it’s rated
Flagged for women who are or may become pregnant and for breastfeeding women; no cap for other adults. EFSA's 2026 tolerable weekly intake for dioxins and PCBs is 0.6 pg/kg body weight/week, 42 pg for 70 kg. These are EFSA's data for cheese of all types in Europe (923 samples), not processed cheese: a lower-bound mean of 0.24 pg/g of fat, which at American cheese's 30.6% fat is 0.0734 pg/g. About 572 g a week eaten alone would reach the limit. A 30 g serving is 5.25% of it, and a daily one 36.7%, adding 3.9% to 11.7% to the average adult's weekly exposure, far from doubling it.
Intake: one 30 g serving, 70 kg adult (Health Canada TRA) · Level in the food: 0.073 pg WHO 2022 toxic equivalents/g (mean, n = 923)
Measured on: EFSA 2026 Table 11, FoodEx2 level 2 'Cheese' (milk and dairy products; N = 923; European occurrence data 2013-2023), WHO2022 mean lower bound 0.24 pg WHO-toxic equivalents/g FAT x 0.306 (Foundation 325198 total lipid 30.6 g/100 g) = 0.0734 pg/g of processed American cheese
- CFIA 2019-21, all cheeses, lower bound
Worth knowing
2,100greaches the limit in a weekCounted from zero, eaten alone: for scale only.An average adult’s intake is already at or past this limit before this food, so there is no room left to count grams against.0.605 pg (WHO 2022 toxic equivalents) per 30 g servingCFIA dioxins in dairy (2019–2021) · grade B ?
How it’s rated
Flagged for women who are or may become pregnant and for breastfeeding women; no cap for other adults. EFSA's 2026 tolerable weekly intake for dioxins and PCBs is 0.6 pg/kg body weight/week, 42 pg for 70 kg. The data cover all cheese types; processed cheese cannot be told apart. On the lower-bound mean of 120 CFIA samples (0.0202 pg/g; 72.8% of congener results were below detection), about 2,081 g a week eaten alone would reach it; non-detects count as zero, so it could be lower. A 30 g serving is 1.44% of the weekly limit, and a daily one 10.1%, adding 1.1% to 3.2% to the average adult's weekly exposure, far from doubling it.
Intake: one 30 g serving, 70 kg adult (Health Canada TRA) · Level in the food: 0.02 pg WHO 2022 toxic equivalents/g (mean, n = 120)
Measured on: CFIA 2019-2021 dairy targeted survey, product 'Cheese' (ALL cheese types, no type flag): n = 120 samples (Domestic 78, Import 28, Unknown 14; sampled 2019 (30), 2020 (63), 2021 (27); mean fat 27.7%, fat 5.7% to 49.2%); pg/g of sample (wet weight); WHO2022 recompute from congener rows x EFSA 2026 Table 1 TEFs; CFIA's own totals are WHO2005. CATEGORY, not processed American cheese: the data cannot identify processed cheese
- Half-and-half cream
Worth knowing for a 15.3 g serving
2%of the weekly limit in one 15.3 g serving, on top of what food already bringsFor scale: 920 g a week, eaten alone, would reach it.An average adult’s intake is already at or past this limit before this food, so there is no room left to count grams against.0.699 pg (WHO 2022 toxic equivalents) per 15.3 g servingCFIA dioxins in dairy (2019–2021) · grade A ?
How it’s rated
Flagged for women who are or may become pregnant and for breastfeeding women; no cap for other adults. EFSA's 2026 tolerable weekly intake for dioxins and PCBs is 0.6 pg/kg body weight/week, 42 pg for 70 kg. On the upper-bound mean of the same 12 CFIA samples (0.0456 pg/g), about 921 g a week eaten alone would reach it. A 15 mL serving (15.3 g) is 1.67% of the weekly limit, and a daily one 11.7%, adding 1.2% to 3.7% to the average adult's weekly exposure, far from doubling it.
Intake: one 15 mL (1 tbsp; 15.3 g) serving, 70 kg adult (Health Canada TRA) · Level in the food: 0.046 pg WHO 2022 toxic equivalents/g (mean, n = 12)
Measured on: CFIA 2019-2021 dairy targeted survey, product 'Cream', fat under 14% (half and half, 10-12% cream): n = 12 samples (fat 7.8% to 13.9%, n = 12; mean fat 10.8%); all of Canadian origin, sampled 2019-2020 (5 in 2019, 7 in 2020); pg/g of sample (wet weight); WHO2022 recompute from congener rows x EFSA 2026 Table 1 TEFs; CFIA's own totals are WHO2005
1 other measurement of this food
- CFIA 2019-21 cream survey, half and half, lower bound
Worth knowing
More than anyone eatsNo realistic amount reaches the limit.An average adult’s intake is already at or past this limit before this food, so there is no room left to count grams against.0.103 pg (WHO 2022 toxic equivalents) per 15.3 g servingCFIA dioxins in dairy (2019–2021) · grade A ?
How it’s rated
The counted figure is 6,300 g a week, about 59 servings a day.
Flagged for women who are or may become pregnant and for breastfeeding women; no cap for other adults. EFSA's 2026 tolerable weekly intake for dioxins and PCBs is 0.6 pg/kg body weight/week, 42 pg for 70 kg. On the lower-bound mean of 12 CFIA half-and-half samples (0.0067 pg/g; 76.7% of congener results were below detection), about 6,249 g a week eaten alone would reach it; non-detects count as zero, so the true amount could be lower. A 15 mL serving (15.3 g) is 0.25% of the weekly limit, and a daily one 1.7%, adding 0.2% to 0.5% to the average adult's weekly exposure, far from doubling it.
Intake: one 15 mL (1 tbsp; 15.3 g) serving, 70 kg adult (Health Canada TRA) · Level in the food: 0.007 pg WHO 2022 toxic equivalents/g (mean, n = 12)
Measured on: CFIA 2019-2021 dairy targeted survey, product 'Cream', fat under 14% (half and half, 10-12% cream): n = 12 samples (fat 7.8% to 13.9%, n = 12; mean fat 10.8%); all of Canadian origin, sampled 2019-2020 (5 in 2019, 7 in 2020); pg/g of sample (wet weight); WHO2022 recompute from congener rows x EFSA 2026 Table 1 TEFs; CFIA's own totals are WHO2005
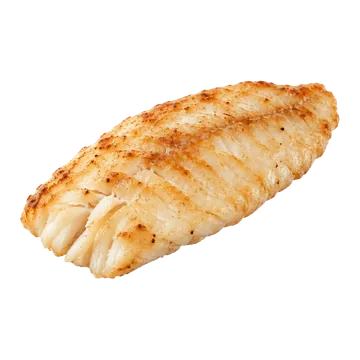 Tilapia, cooked
Nothing to watch for a 100 g serving
10%of the weekly limit in one 100 g serving, on top of what food already bringsFor scale: 990 g a week, eaten alone, would reach it.An average adult’s intake is already at or past this limit before this food, so there is no room left to count grams against.4.23 pg (d’équivalents toxiques) per 100 g servingCFIA dioxins survey (2014–2019) · grade C ?
How it’s rated
No cap: EFSA's 2026 tolerable weekly intake for dioxins and PCBs is 0.6 pg WHO 2022 toxic equivalents/kg body weight/week, 42 pg a week at 70 kg. At the CFIA upper-bound mean of 0.0423 pg/g on a cooked basis (2 samples only), about 994 g of cooked tilapia a week would reach it (6,114 g on the lower bound). The upper bound is mostly detection-limit contribution, and 2 samples is thin.
Intake: 100 g cooked (HC TRA I.3), one serving a day · Level in the food: 0.042 pg WHO 2022 toxic equivalents/g (mean, WHO 2022 toxic equivalents recomputed from congeners (as-sold upper bound mean 0.0326 x 1.30), n = 2)
Measured on: CFIA targeted survey 2014-2019, product "Tilapia", 2 samples (one Canada, one Ecuador, 2017), Percent Fat 0.6 and 5.6. Preparation not stated (as sold, raw fillet presumed). WHO2022 recomputed: lower bound mean 0.0053, upper bound mean 0.0326 pg/g as sold; WHO2005 from the same rows lower bound 0.0032, upper bound 0.0405. Cooked-basis = upper bound x 1.30 (water 78.08 raw to 71.59 cooked g/100 g; an upper bound).
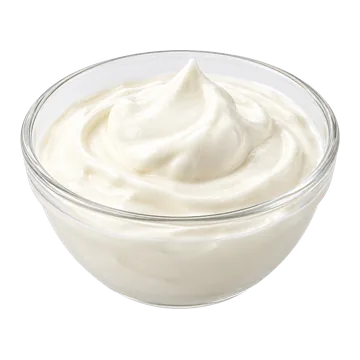 Sour cream
Worth knowing for a 29 g serving
2%of the weekly limit in one 29 g serving, on top of what food already bringsFor scale: 1,400 g a week, eaten alone, would reach it.An average adult’s intake is already at or past this limit before this food, so there is no room left to count grams against.0.887 pg per 29 g servingCFIA dioxins in dairy (2019–2021) · grade B ?
How it’s rated
Flagged for sensitive life stages, with no cap for other adults: against EFSA's 2026 tolerable weekly intake (TWI) of 42 pg for 70 kg, about 1,383 g of sour cream a week eaten alone would reach it at the upper bound (mean 0.03036 pg/g). One serving is 2.11% of the weekly limit; a daily serving is 14.8%. The figure is a proxy: 24 CFIA cream samples with 14% to under 22% fat (74.3% non-detects), since the survey has no sour cream category.
Intake: one 29 g serving (HC TRA D.14), 70 kg adult; weekly limit 0.6 pg/kg body weight = 42 pg · Level in the food: 0.03 pg WHO 2022 toxic equivalents/g (mean (recomputed on WHO2022 TEFs from the CFIA congener rows; 24 cream samples with 14% to under 22% fat), n = 24)
Measured on: PROXY: CFIA Food Safety Action Plan targeted survey, dioxins and dioxin-like compounds in dairy 2019-2021, product 'Cream' (the survey has no sour cream or cream cheese category), fat band 14% to under 22% (mean 16.6%, table and coffee cream), Canada, sampled 2019 (4), 2020 (10), 2021 (10); pg/g of sample (wet weight)
1 other measurement of this food
- CFIA 2019-21, table cream standing in, lower bound
Worth knowing
4,000greaches the limit in a weekCounted from zero, eaten alone: for scale only.An average adult’s intake is already at or past this limit before this food, so there is no room left to count grams against.0.31 pg per 29 g servingCFIA dioxins in dairy (2019–2021) · grade B ?
How it’s rated
Flagged for sensitive life stages, with no cap for other adults: EFSA's 2026 tolerable weekly intake (TWI) for dioxins and dioxin-like compounds is 0.6 pg WHO 2022 toxic equivalents/kg body weight/week, 42 pg for 70 kg. Eaten alone, about 3,959 g of sour cream a week would reach it at the lower bound (mean 0.01061 pg/g), so that is an upper limit on the grams. One serving is 0.74% of the weekly limit; a daily serving is 5.2%. The figure is a proxy: 24 CFIA cream samples with 14% to under 22% fat (74.3% non-detects), since the survey has no sour cream category.
Intake: one 29 g serving (HC TRA D.14), 70 kg adult; weekly limit 0.6 pg/kg body weight = 42 pg · Level in the food: 0.011 pg WHO 2022 toxic equivalents/g (mean (recomputed on WHO2022 TEFs from the CFIA congener rows; 24 cream samples with 14% to under 22% fat), n = 24)
Measured on: PROXY: CFIA Food Safety Action Plan targeted survey, dioxins and dioxin-like compounds in dairy 2019-2021, product 'Cream' (the survey has no sour cream or cream cheese category), fat band 14% to under 22% (mean 16.6%, table and coffee cream), Canada, sampled 2019 (4), 2020 (10), 2021 (10); pg/g of sample (wet weight)
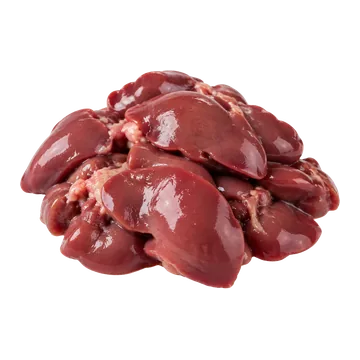 Chicken liver, raw
Worth knowing
1,400greaches the limit in a weekCounted from zero, eaten alone: for scale only.An average adult’s intake is already at or past this limit before this food, so there is no room left to count grams against.How it’s rated
Flagged: the tolerable weekly intake for dioxins and PCBs is 42 pg a week at 70 kg (EFSA 2026, WHO 2022 toxic equivalents). On the upper-bound European mean of 0.03 pg/g (142 samples), about 1,400 g of liver a week would reach it, and a 100 g serving is 7% of the weekly limit. It pairs with the lower-bound row to give the two bounds.
Intake: 100 g raw serving · Level in the food: 0.03 pg WHO 2022 toxic equivalents/g (mean (142 samples), n = 142)
Measured on: EFSA 2026 update, FoodEx2 'Chicken liver', pg toxic equivalents/g whole weight; upper bound
1 other measurement of this food
- EFSA 2026, European chicken liver, lower bound
Worth knowing
4,200greaches the limit in a weekCounted from zero, eaten alone: for scale only.An average adult’s intake is already at or past this limit before this food, so there is no room left to count grams against.How it’s rated
Flagged: EFSA's 2026 tolerable weekly intake for dioxins and PCBs is 0.6 pg WHO 2022 toxic equivalents/kg body weight/week, 42 pg a week at 70 kg. On the European lower-bound mean of 0.01 pg/g (142 samples, as sampled), about 4,200 g of liver a week would reach it, an upper bound on the grams; because the table rounds to two decimals, the true mean could lie between 0.005 and 0.015, giving 2,800 to 8,400 g. A 100 g serving is about 2% of the weekly limit. These are European data.
Intake: 100 g raw serving · Level in the food: 0.01 pg WHO 2022 toxic equivalents/g (mean (142 samples), n = 142)
Measured on: EFSA 2026 update, European food occurrence data, FoodEx2 'Chicken liver', pg toxic equivalents/g whole weight, sum of 29 PCDD/Fs and dl-PCBs; as sampled
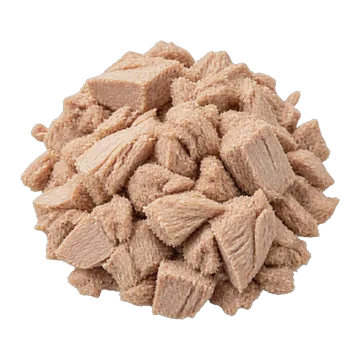 Light tuna, canned in water
Worth knowing for a 55 g serving
3%of the weekly limit in one 55 g serving, on top of what food already bringsFor scale: 2,100 g a week, eaten alone, would reach it.An average adult’s intake is already at or past this limit before this food, so there is no room left to count grams against.1.08 pg (WHO 2022 toxic equivalents, recomputed lower bound mean 0.0197 x 55 g; upper bound 0.0842 gives 4.63) per 55 g servingCFIA dioxins survey (2014–2019) · grade A ?
How it’s rated
Flagged for pregnancy, planning a pregnancy and breastfeeding; no cap for other adults. A daily serving is 18% (lower bound) to 77% (upper bound) of EFSA's 2026 tolerable weekly intake, 0.6 pg WHO 2022 toxic equivalents/kg body weight/week, on Foodtopsy's recalculation of the CFIA results with the 2022 toxic equivalency factors; one serving a week is 2.6-11%. A daily serving adds 1.9-5.8% to EFSA's adult average intake of 1.87-5.64 pg/kg body weight/week (8.2-25% at the upper-bound concentration): far from doubling, so no cap either way.
Intake: one 55 g serving a day, 70 kg adult · Level in the food: 0.027 pg WHO 2005 toxic equivalents/g (wet weight) (mean, n = 74)
Measured on: food-specific: CFIA targeted survey 2014-2019, 'Tuna', 74 samples (67 Thailand imports); published lower bound mean 0.0267, upper bound mean 0.1038; median lower bound 0.0053. Product form (canned or frozen) and light/albacore not stated. 80% of congener results are non-detects, so upper bound is mostly detection limit (detection limit) arithmetic
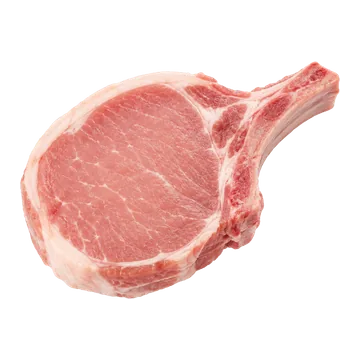 Pork chop, raw
Worth knowing for a 125 g serving
1%of the weekly limit in one 125 g serving, on top of what food already bringsFor scale: 11,000 g a week, eaten alone, would reach it.An average adult’s intake is already at or past this limit before this food, so there is no room left to count grams against.CFIA dioxins survey (2014–2019) · grade B ?
How it’s rated
Flagged: EFSA's 2026 tolerable weekly intake (TWI) for dioxins and dioxin-like compounds is 0.6 pg WHO 2022 toxic equivalents/kg body weight/week, 42 pg a week for 70 kg. Eaten alone, about 10,742 g of raw chop a week would reach it at the lower bound (mean 0.00391 pg/g), but only 591 g a week at the upper bound (0.07105 pg/g), because most congener results were non-detects. Based on 129 CFIA raw pork samples (2014-2019 survey); raw pork as sampled, and the cut is not stated.
Intake: 125 g raw chop (HC TRA L.6) · Level in the food: 0.004 pg WHO 2022 toxic equivalents/g (mean (129 samples), WHO2022 recompute of the CFIA raw-pork congener data (carried from the wave-4 pork sausage row, the same recompute bacon and ham carry), n = 129)
Measured on: CFIA Food Safety Action Plan targeted survey 2014-2019, raw 'Pork' (cut not stated, mean fat 14%), sampled 2015-2018 (2015: 57, 2016: 12, 2017: 42, 2018: 17), total lower bound toxic equivalents per sample; the survey applies the WHO 2005 TEFs. The survey does not say whether the retail sample was raw or cooked; "raw" is our reading.
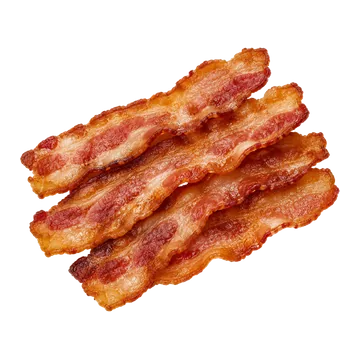 Bacon, pan-fried
Worth knowing for a 15 g serving
0%of the weekly limit in one 15 g serving, on top of what food already bringsFor scale: 11,000 g a week, eaten alone, would reach it.An average adult’s intake is already at or past this limit before this food, so there is no room left to count grams against.CFIA dioxins survey (2014–2019) · grade B ?
How it’s rated
The counted figure is 11,000 g a week, about 102 servings a day.
Flagged: EFSA's 2026 tolerable weekly intake for dioxins and PCBs is 0.6 pg WHO 2022 toxic equivalents/kg body weight/week, 42 pg a week. The only occurrence figure is carried from raw pork cuts (CFIA 2014-2019, 129 samples, mean fat 14.1%), not bacon: eaten alone about 10,742 g a week would reach the limit at the lower bound (an upper bound on grams), 591 g a week at the upper bound of 0.07105 pg/g. Dioxins sit in fat and bacon is 35-43% fat, so a fat-scaled concentration would be higher; no conversion was made because no sourced factor exists. This is the weakest fit among the related meats.
Intake: one 15 g reference serving a day, 70 kg adult · Level in the food: 0.004 pg WHO 2022 toxic equivalents/g (mean (129 samples), CARRIED from the wave-4 pork sausage row; related food (raw pork cuts as sampled), n = 129)
Measured on: CFIA targeted survey 2014-2019, product 'Pork' (raw cuts as sampled, mean fat 14.1%), pg/g total sample weight, WHO2022 recompute; NOT bacon
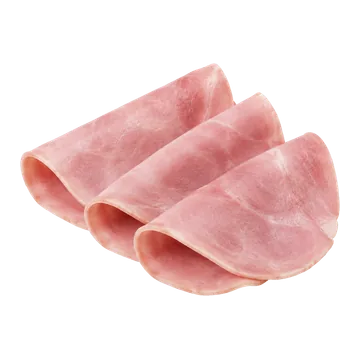 Ham, sliced
Worth knowing for a 55 g serving
1%of the weekly limit in one 55 g serving, on top of what food already bringsFor scale: 11,000 g a week, eaten alone, would reach it.An average adult’s intake is already at or past this limit before this food, so there is no room left to count grams against.CFIA dioxins survey (2014–2019) · grade B ?
How it’s rated
Flagged: EFSA's 2026 tolerable weekly intake for dioxins and dioxin-like PCBs is 0.6 pg WHO 2022 toxic equivalents/kg body weight/week, 42 pg a week for 70 kg. On CFIA's 2014–2019 raw pork samples, eaten alone, about 10,742 g a week would reach it at the lower bound (0.00391 pg/g, so an upper bound on grams) and 591 g a week at the upper bound (0.07105 pg/g). 85.4% of the congener results were non-detect, so the bound decides the answer. These are raw cuts as sampled, not cured, sliced ham, and no sourced conversion exists.
Intake: one 55 g reference serving a day, 70 kg adult · Level in the food: 0.004 pg WHO 2022 toxic equivalents/g (mean (129 samples), CARRIED from the wave-4 pork sausage row; related food (raw pork cuts as sampled), n = 129)
Measured on: CFIA targeted survey 2014-2019, product 'Pork' (raw cuts as sampled, mean fat 14.1%), pg/g total sample weight, WHO2022 recompute from CFIA's congener rows; NOT cured, sliced or cooked ham
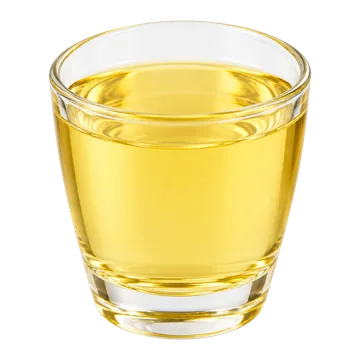 Soybean oil
Nothing to watch for a 9.2 g serving
No gram figure for this foodThe measurement and the limit use different versions of the dioxin scale, so they can’t be compared.How it’s rated
No cap: this is a category figure for vegetable oils and fats, shortenings and margarines, not for one oil. EFSA's 2026 tolerable weekly intake for dioxins and PCBs is 0.6 pg/kg body weight/week, 42 pg for 70 kg. For orientation only, one serving carries 0.28 pg toxic equivalents, and seven servings a week 1.9 pg, 4.6% of the weekly limit. No grams figure is given: the CFIA survey uses the 2005 WHO toxic equivalency factors and EFSA's limit rests on the 2022 factors, and mixing the two hides an error of 27-35%. The average adult already takes in 3-9 times the limit, so a food is judged by what a serving adds: a few percent, not a doubling.
Intake: one 9.21 g (10 mL) serving a day, 70 kg adult · Level in the food: 0.03 pg toxic equivalents/g (mean of positive results only (max 1.0113), n = 282)
Measured on: CFIA targeted survey, April 2012 to March 2014, Canadian retail: 'Vegetable oils and fats' (single oils such as olive, sesame, canola, blends, shortenings and margarines), 282 samples, 273 (97%) detected; per g FAT. Sunflower oil highest average, grape seed lowest (no per-oil numbers in text).
 Cod, raw
Worth knowing for a 125 g serving
No gram figure for this foodThe measurement and the limit use different versions of the dioxin scale, so they can’t be compared.CFIA dioxins survey (2014–2019) · grade A ?
How it’s rated
Flagged: EFSA's 2026 tolerable weekly intake for dioxins and PCBs is 0.6 pg WHO 2022 toxic equivalents/kg body weight/week, but the survey is on the WHO2005 basis, so no grams figure is given until it is recomputed. The CFIA survey (2014-2019, raw cod, 18 samples, mean fat 5.1%) gives a lower-bound mean of 0.00505 pg WHO 2005 toxic equivalents/g (median 0.0045, max 0.0219) and an upper-bound mean of 0.07985 (median 0.0622, max 0.1455). Cod is a lean fish; oily fish such as salmon (0.51) are much higher.
Intake: 125 g raw (HC TRA I.3) · Level in the food: 0.005 pg WHO 2005 toxic equivalents/g (wet weight) (mean (18 samples; median 0.0045, max 0.0219), n = 18)
Measured on: CFIA Food Safety Action Plan targeted survey 2014-2019, raw 'Cod' (mean fat 5.1%), sampled 2017 (12), 2018 (5) and 2019 (1), total lower bound toxic equivalents per sample, WHO 2005 TEFs; the first sample listed is an import from China. The survey does not say whether the retail sample was raw or cooked; "raw" is our reading.
 Farmed salmon, cooked
Worth knowing for a 100 g serving
No gram figure for this foodThe measurement and the limit use different versions of the dioxin scale, so they can’t be compared.Jensen 2020 · grade B ?
How it’s rated
Flagged for women who are or may become pregnant; no cap for other adults (EFSA's limit protects the sons of future mothers). The share per serving comes from a study of farmed Atlantic salmon fillets in Norway (Jensen 2020), on the older 2005 toxic equivalency factors; EFSA says the 2022 factors lower exposure estimates by about 27-35%, so the share against the 2026 limit is overstated.
Intake: one 100 g serving a day, 70 kg adult; limit = EFSA 2026 tolerable weekly intake (TWI) 0.6 pg WHO 2022 toxic equivalents/kg body weight/week = 42 pg/week · Level in the food: 0.51 pg toxic equivalents/g (mean, n = 10)
Measured on: single study: farmed Atlantic salmon fillets, Norway (Skjervøy, 2017), raw, trimmed of visible fat; WHO-TEF 2005; not Canadian
 Farmed salmon, raw
Worth knowing for a 125 g serving
No gram figure for this foodThe measurement and the limit use different versions of the dioxin scale, so they can’t be compared.Jensen 2020 · grade B ?
How it’s rated
Flagged for women who are or may become pregnant; no cap for other adults (EFSA's limit protects the sons of future mothers). The share per serving comes from a study of farmed Atlantic salmon fillets in Norway (Jensen 2020), on the older 2005 toxic equivalency factors; EFSA says the 2022 factors lower exposure estimates by about 27-35%, so the share against the 2026 limit is overstated.
Intake: one 125 g raw serving a day, 70 kg adult; limit = EFSA 2026 tolerable weekly intake (TWI) 0.6 pg WHO 2022 toxic equivalents/kg body weight/week = 42 pg/week · Level in the food: 0.51 pg toxic equivalents/g (mean, n = 10)
Measured on: single study: farmed Atlantic salmon fillets, Norway (Skjervøy, 2017), raw, trimmed of visible fat; WHO-TEF 2005; not Canadian
 Ground turkey, 93% lean, raw
Worth knowing for a 100 g serving
No gram figure for this foodThe measurement and the limit use different versions of the dioxin scale, so they can’t be compared.CFIA dioxins survey (2014–2019) · grade B ?
How it’s rated
Flagged: EFSA's 2026 tolerable weekly intake (TWI) for dioxins and dioxin-like compounds is 0.6 pg WHO 2022 toxic equivalents/kg body weight/week, but the survey figures are on the older WHO2005 basis, so no grams figure is given until they are recomputed. In 24 CFIA raw turkey samples (2014-2019 survey; cut and form not stated) the lower-bound mean is 0.0063 pg/g (median 0.0004, maximum 0.1126) and the upper-bound mean 0.08478 pg WHO 2005 toxic equivalents/g (median 0.0722, maximum 0.2639). One sample at 0.1126 pulls the mean up.
Intake: 100 g raw (HC TRA L.7) · Level in the food: 0.006 pg WHO 2005 toxic equivalents/g (wet weight) (mean (24 samples; median 0.0004, max 0.1126), n = 24)
Measured on: CFIA Food Safety Action Plan targeted survey 2014-2019, raw 'Turkey' (cut and form not stated, mean fat 5.7%), sampled 2015-2018 (2015: 10, 2016: 3, 2017: 6, 2018: 5), total lower bound toxic equivalents per sample, WHO 2005 TEFs. The survey does not say whether the retail sample was raw or cooked; "raw" is our reading.
Sources
- CFIA. Dioxins and dioxin-like compounds in selected foods, targeted survey April 2012 to March 2014
cfia-dioxins-2012-14· full text read · Open Government Licence - Canada - CFIA, Dioxins and Dioxin-Like Compounds in Selected Foods - April 1, 2012 to March 31, 2014 (Food chemistry, targeted surveys, final report; page modified 2019-04-17)
cfia-dioxins-2012-2014· full text read · not checked (CFIA page); the open-data resource is OGL-Canada - CFIA, Food Safety Action Plan Targeted Survey: Dioxins and Dioxin-like Compounds in Selected Foods 2014-2019 (data and 2-page overview PDF; report page inspection.canada.ca)
cfia-dioxins-2014-2019· dataset · Open Government Licence – Canada 2.0 - CFIA, Food Safety Action Plan targeted survey: dioxins and dioxin-like compounds in dairy products 2019-2021 (open data resource 906855be-4166-44df-a5bf-c90a3c45e61b; Cream n=67, Cheese n=120, Milk 39, Kefir 70 samples)
cfia-dioxins-dairy-2019-2021· dataset · Open Government Licence - Canada - EFSA CONTAM Panel (2026). Update of the risk assessment on dioxins and dioxin-like PCBs in feed and food. EFSA Journal 2026;24(6):10103. · doi:10.2903/j.efsa.2026.10103
efsa-2026-dioxins· full text read · CC BY-ND - Jensen IJ, Eilertsen KE, Otnæs CHA, Mæhre HK, Elvevoll EO. An update on the content of fatty acids, dioxins, PCBs and heavy metals in farmed, escaped and wild Atlantic salmon (Salmo salar L.) in Norway. Foods 2020;9(12):1901 · doi:10.3390/foods9121901 · PMID 33352671
jensen2020-foods· full text read · CC BY 4.0 (MDPI open access)